

When you track expenses and revenue by the job, you can see job-level profitability and use it to adjust future pricing or inform the way you resource projects.
Introduction
Job profitability is one of the most important metrics for a construction business. It unlocks a waterfall of information about your operation (like your margins on different projects) that can help you make critical financial decisions.
In order to see job profitability, contractors have to track the expenses and revenue associated with every project. This lesson walks you through how to set up a system to do that, from tagging transactions to getting your very first job profitability report.
Learning Outcomes
By the end of this lesson, you’ll know how to…
Tag expenses and revenue to a job
Split overhead expenses between jobs
Generate and read a job profitability report
Interpret job profitability metrics
Let’s start setting up project-level expense and revenue tracking, so you can run your first job profitability report.
Step 1: Set Up Your Projects
To get a job profitability report, you need two pieces of information about the money you have coming in or going out:
Category: Part of your chart of accounts, categories define the type of transaction you made. They help you break down where you spent money on a job. As an example, your categories might include Workers’ Compensation Insurance and Subcontractors.
Project: Projects define which job a transaction was associated with. For example, your projects could include Main St Bathroom Remodel or Pine St Deck.
We previously published a guide on setting up your chart of accounts as a contractor, so in this lesson we assume your categories are set and you have a system to assign transactions to them.
Now you need a way to assign transactions to projects (in other words, to jobs). In an accounting platform like Ambrook, you can create projects directly in the software. These automatically become tags that you’ll use to mark transactions in your ledger.
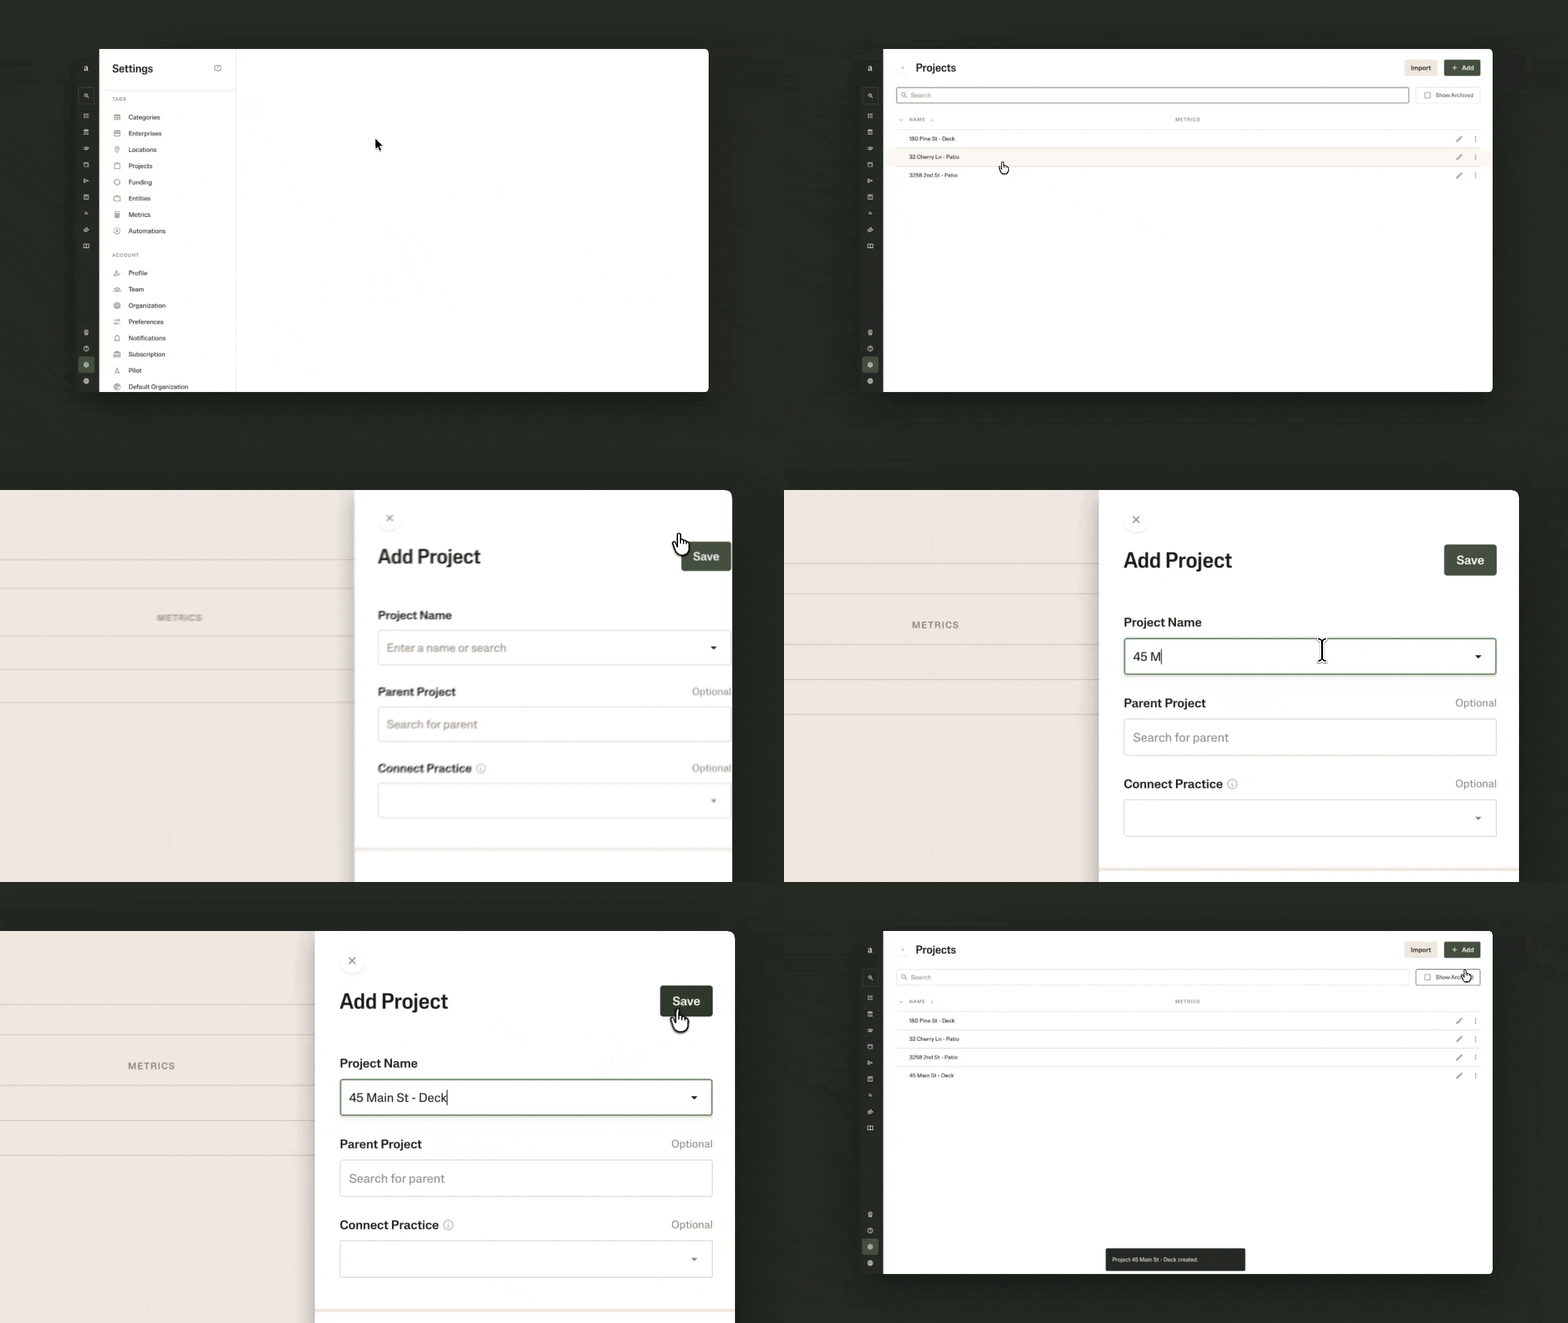
Here’s how to create a project:
In your settings, find the group for Tags and look for Projects.
Choose a name that clearly designates the job this is for.
Optionally, nest your project under a parent project. This might make sense if, say, you’re working on a few related projects for the same client or at the same site.
With the basics set up, let’s configure splits so you can tag transactions that apply to multiple projects.
Step 2: Configure Your Splits
Splits are useful when you have a transaction that doesn’t apply to just one job. For example:
Splitting direct costs: You made one big trip to the lumberyard to buy materials for three jobs. This comes into your ledger as one transaction, but you want to make sure the full amount gets broken down and properly allocated to each of the relevant jobs.
Splitting overhead costs: In order to keep track of net margins for jobs, you want to allocate operating expenses (like company vehicle insurance and fuel) across your projects based on a set rate for each one.
Let’s say you decide to split expenses between jobs based on their square footage, because you know the footprint of your projects influences how much resourcing or planning they take.
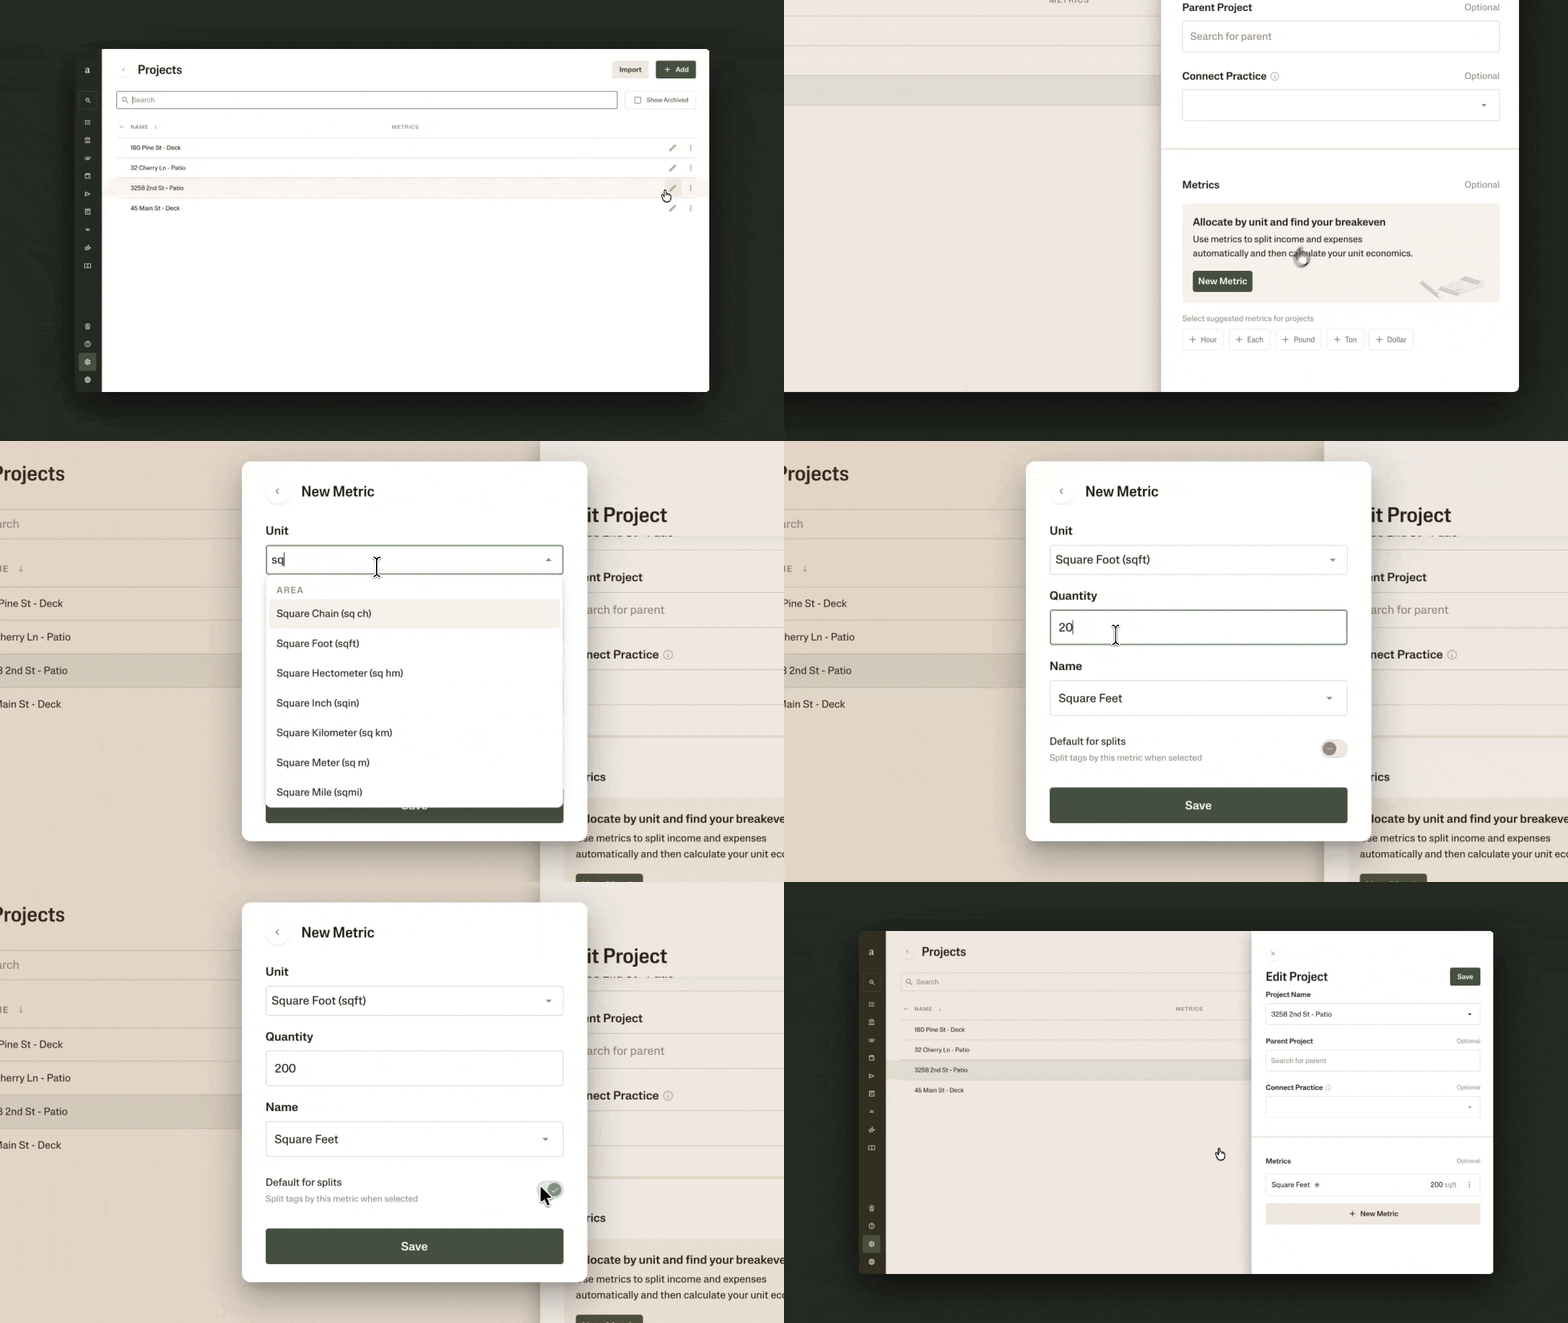
Here’s how you would configure your splits in an accounting software like Ambrook:
Back in one of your projects, scroll to the Metrics section.
Select New Metric and fill in the unit (for example, Square Foot) and quantity.
Before you click Save, make sure to toggle on Default for splits.
Repeat this for each of your projects.
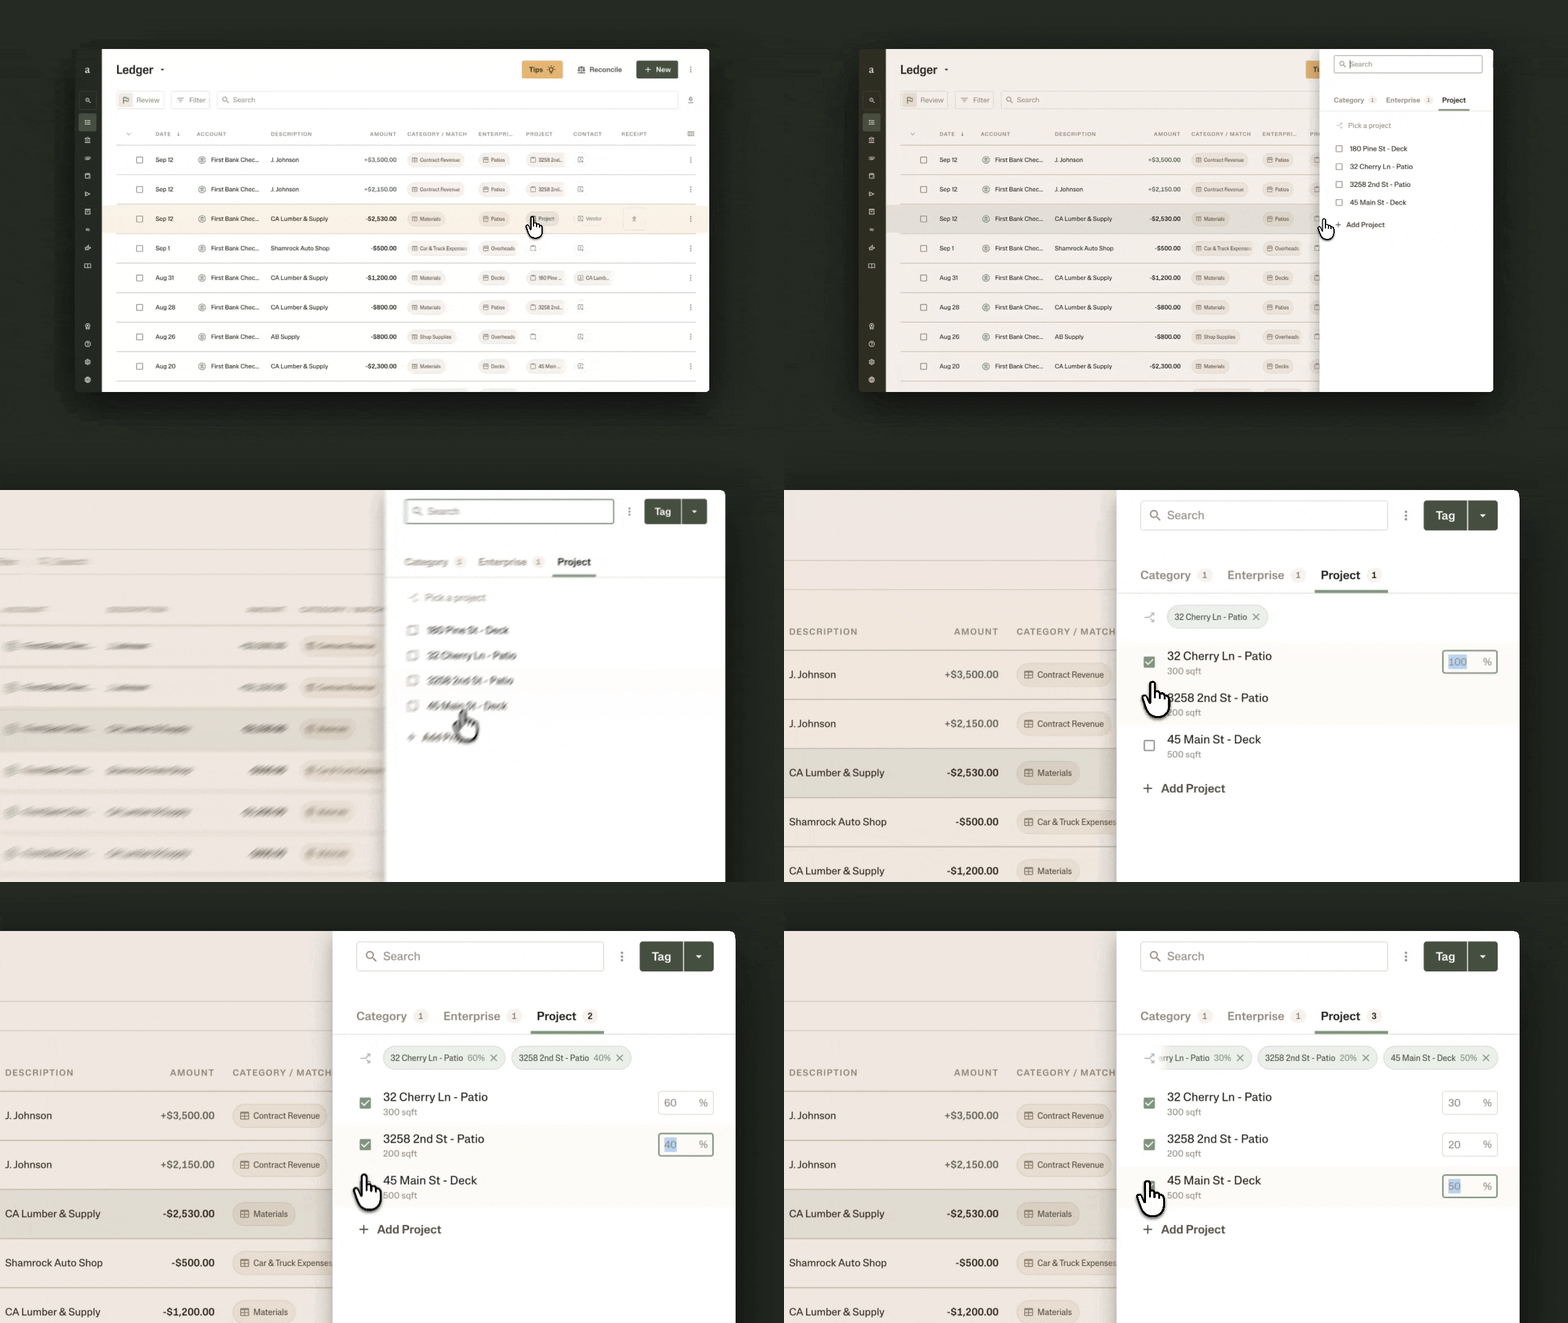
Ambrook will automatically use the quantities you entered to calculate the breakdown when you split an expense between projects. For example, here’s how a transaction would get split between three differently sized projects:
Project 1 is 200 sq ft; it will get allocated 20% of the transaction amount
Project 2 is 300 sq ft; it will get allocated 30% of the transaction amount
Project 3 is 500 sq ft; it will get allocated the remaining 50% of the transaction amount
You’re now ready to start tagging your transactions to the job in Step 3.
Note: Some operators choose to keep overhead costs separate by bucketing them into an Overhead enterprise or project, instead of tagging them to specific projects. In that case, only your overall P&L would account for overhead and show your net margin. Your individual job profitability reports will show gross profit and margin.
Step 3: Tag Transactions to the Job
Your projects and split are set up. Now, it’s a matter of allocating your incoming transactions to the right job when they come into the ledger.
In Ambrook, this means tagging your transactions. You’ll see your projects show up as available tags in the ledger:
From the ledger entry, click Tag Project.
Check the job you want to allocate this transaction to.
If you’re splitting a transaction between multiple jobs, check all of the projects you need. Since we configured splits in Step 2, Ambrook will automatically calculate the breakdown.
The most important part is staying current with these records. When you regularly tag transactions, you can generate a job profitability report anytime, because you have the necessary data already organized.
Tip: Some operators, like Ambrook customer Nathan Wood, set aside a few minutes a day to go through and tag recent transactions. Others prefer to create automations, so most transactions get tagged by the system and operators can simply check for accuracy on a regular basis.
Step 4: Run Your Job Profitability Report
Now that our transactions are tagged, we can generate a job profitability report. This will tell you how much money you’ve made from a given project and help you understand where you spent money on it.
In Ambrook, running a job profitability report boils down to filtering your profit and loss (P&L) statement by the project tags you set up in Step 1.
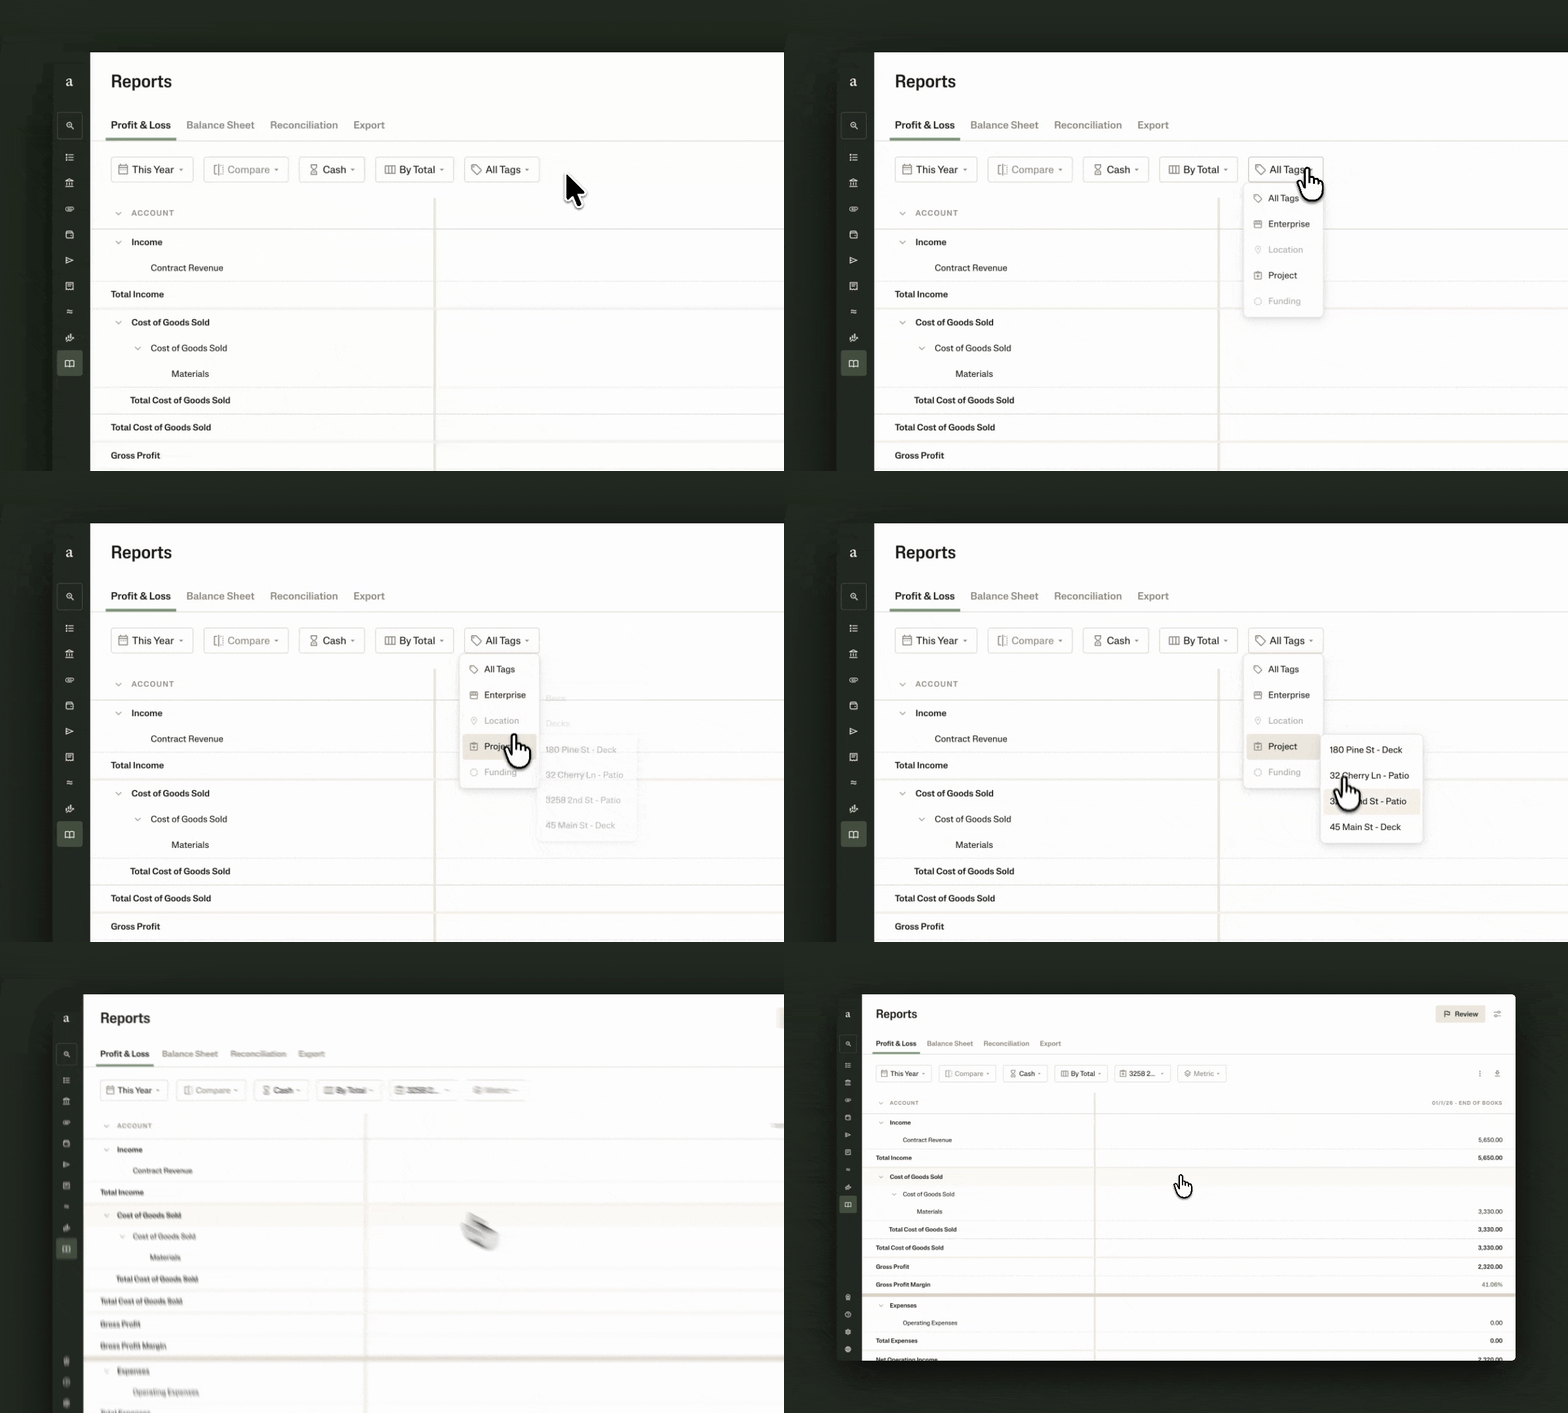
Open Reports and you’ll land on Profit & Loss by default.
In the filters bar, find the option to filter by tag. Click on it to open a dropdown, where you’ll choose Project, then select the specific job you want to run the profitability report for.
The P&L automatically updates to show you the margins for the project you chose.
These numbers allow you to understand per-job performance, like whether you might have underbid for a particular job. In the next step, we’ll talk about how to interpret the metrics in a profitability report.
Step 5: Interpret Profit and Margins
With your report in hand, you get a few metrics that can help inform how you price, source materials, or work with subcontractors for future jobs:
Gross profit tells you how much money you made on a job after subtracting direct costs on a job like subcontracted labor, materials, or hauling expenses.
Gross margin expresses your direct job profitability as a percentage. You can think of it as how much income you kept from a job after covering project-specific expenses like labor and materials.
Net margin expresses your overall job profitability as a percentage, after accounting for operating expenses (also known as overhead), too.
But how do you really interpret those numbers?
Let’s say you’re comparing the margins across a few jobs you recently completed. Here are examples of how you might use that information to make business decisions:
| Observation | Decision |
|---|---|
| Kitchen remodels have lower gross margins than your patio builds due to subcontractor costs | You start building estimates with your subcontractors at the beginning of jobs. This way, your estimates are more accurate from the start and everyone working on the job is on the same page. |
| Your deck jobs using composite have higher margins than decks using pressure-treated wood | You increase margin rates for pressure-treated decking jobs, or work with clients to choose composite as often as it makes sense |
| You notice you aren't making as much money on smaller footprint jobs | You prioritize taking on larger-sized jobs going forward |
Over time, tracking job profitability will give you the consistent data you need to set budgets and prices that work for you, build subcontractor and supplier relationships that make sense for your operation, and keep growing your business.
Resources to Dive Deeper
Review your chart of accounts as you’re setting up a system to track per-job expenses and revenue.
Learn more about reading an income statement and how to understand the numbers on a profitability report.
FAQs
What is a job profitability report?
A job profitability report shows you how well one particular job performed. Typically, it includes your gross profit, gross margin, and net margin for that job, so you can determine how much you earned on the project and where you spent money on it.
How do I allocate overhead expenses to jobs?
In Ambrook, you can add metrics to your projects based on how you typically divide overhead costs between jobs. These metrics become auto-calculated splits: When you’re tagging an overhead expense in your ledger that applies to multiple jobs, you can check all the relevant projects and Ambrook will break down the transaction based on your splits.
What’s the difference between a job profitability report and a P&L?
A job profitability report and a P&L are similar. Your job profitability report tells you how a single project or job performed. In this lesson, it’s built around gross profit and gross margin.
Your P&L shows you how your overall business performed over a period of time. It typically shows you net profit and net margins across the operation, which tells you how much you’re making after accounting for direct job costs and overhead costs.
Why do I need to tag transactions to the job?
Tagging transactions by the project is what makes it possible to see job profitability and compare your margins across different jobs. In turn, those metrics can help you decide how to price future jobs or manage project resources like subcontractors or supplier relationships.
This resource is provided for general informational purposes only. It does not constitute professional tax, legal, or accounting advice. The information may not apply to your specific situation. Please consult with a qualified tax professional regarding your individual circumstances before making any tax-related decisions.


