Dig Into Your Revenues and Expenses and Find Pathways to Profitability
Also called a ‘profit and loss’ or ‘P&L’ statement, the income statement organizes and lists all of your revenues and expenses in a way that makes it easy to calculate and understand the profitability of your business.
It answers one of the most important questions a business owner can ask: did my business make a profit or a loss, and why? When set up properly, the income statement can be a valuable tool in your day-to-day decision making, even in times of the year when little cash is trading hands.
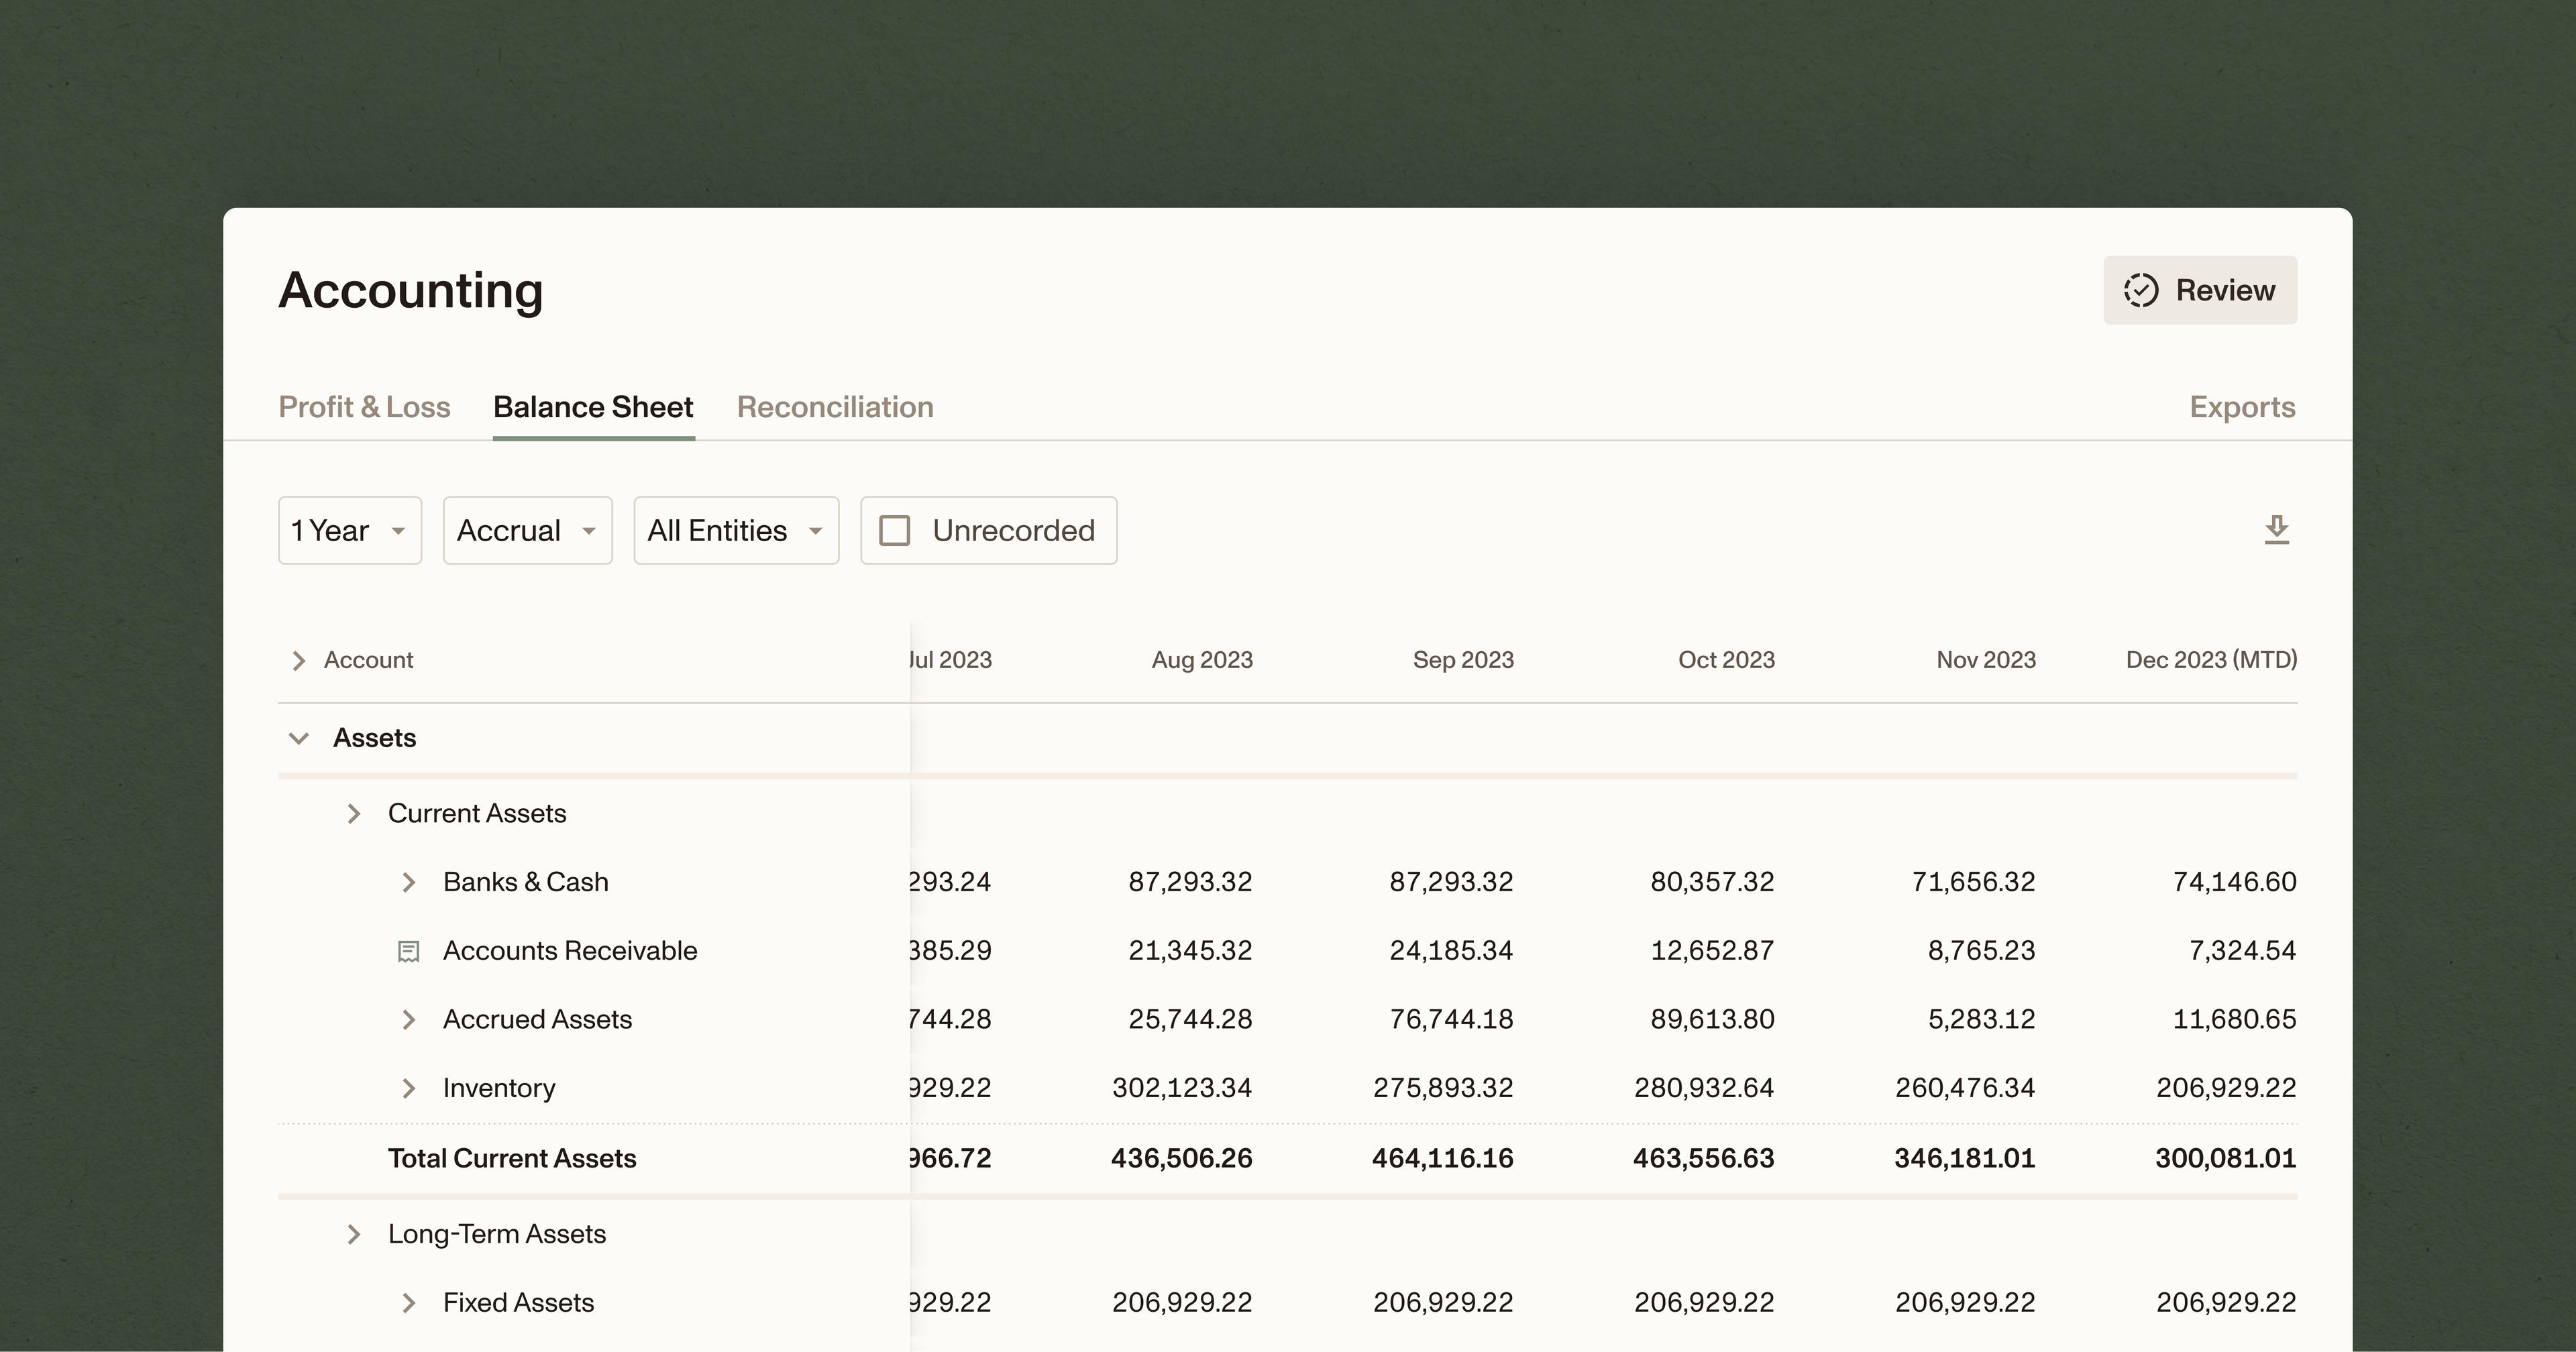
Unlike other financial statements like the balance sheet, which captures your business’ financials at a specific point in time, the income statement covers a range in time: usually a year, but sometimes a quarter or even a single month.
Don’t worry if you aren’t in the habit of regularly producing income statements, your business probably already collects most of the information it needs to set one up. Here we’ll walk you through the basics: what goes into an income statement, how to read one, and what it can tell you about the health of your business.
Why is it important?
An income statement shows how much value your business produced over a certain period of time, and how much it cost to produce that value in the form of labor, supplies, equipment, land, etc.
If your business is losing money, an income statement can shed light on what’s driving those losses and help you pinpoint areas for improvement, like managing your production costs better or even shutting down an unprofitable enterprise.
If you’re making a profit, an income statement can tell you why that’s the case, and help you maintain and build on your success in the future.
Why can’t I just use my tax return?
You already report your profits or losses to the IRS every year. Why not just use your tax return to measure your business’ profitability?
While it’s true that they’re similar, the taxable income you report on your tax return will almost always differ from the income shown on your income statement. This comes down to the difference between tax accounting and managerial accounting.
Tax Accounting involves calculating and minimizing your total taxable income while sticking to a series of strict IRS rules around accounting for revenues and expenses.
Managerial Accounting is about generating financial statements, measuring actual profitability and economic value, and helping owners figure out what exactly is happening inside their business.
One of the biggest differences between the two accounting systems is the use of cash and accrual accounting.
Cash vs. accrual accounting
Businesses that aren’t in the habit of producing financial statements will often do their accounting on a cash basis, which means recording income and expenses only when cash actually enters or leaves their bank account.
Cash basis accounting is fine for putting together a small business tax return, but it isn’t always the best system when preparing an income statement because the value your business creates isn’t always accounted for by cash sales.
For example, successfully getting through the calving season doesn’t necessarily involve many cash transactions, but it produces significant value for a farm. Increases in the volume and/or value of your inventories of feed and grain can also result in income that isn’t captured by cash sales.
This is where accrual accounting comes in, which recognizes income at the moment that it’s earned, rather than the moment it hits your bank account.
For example, if a grain producer receives an order for $15,000 of grain on December 1, 2023 and doesn’t receive payment for the grain until February 1, 2024, they’ll record the transaction in February of 2024 under the cash basis system.
Under the accrual system, however, they’ll record the revenue in December of 2023, when the order was made, which will affect the income they report for both years.
Accrual accounting involves more work, but it results in a more accurate and up to date picture of a business’ finances, which is why we prefer it over cash accounting when putting together income statements.
How to read an income statement
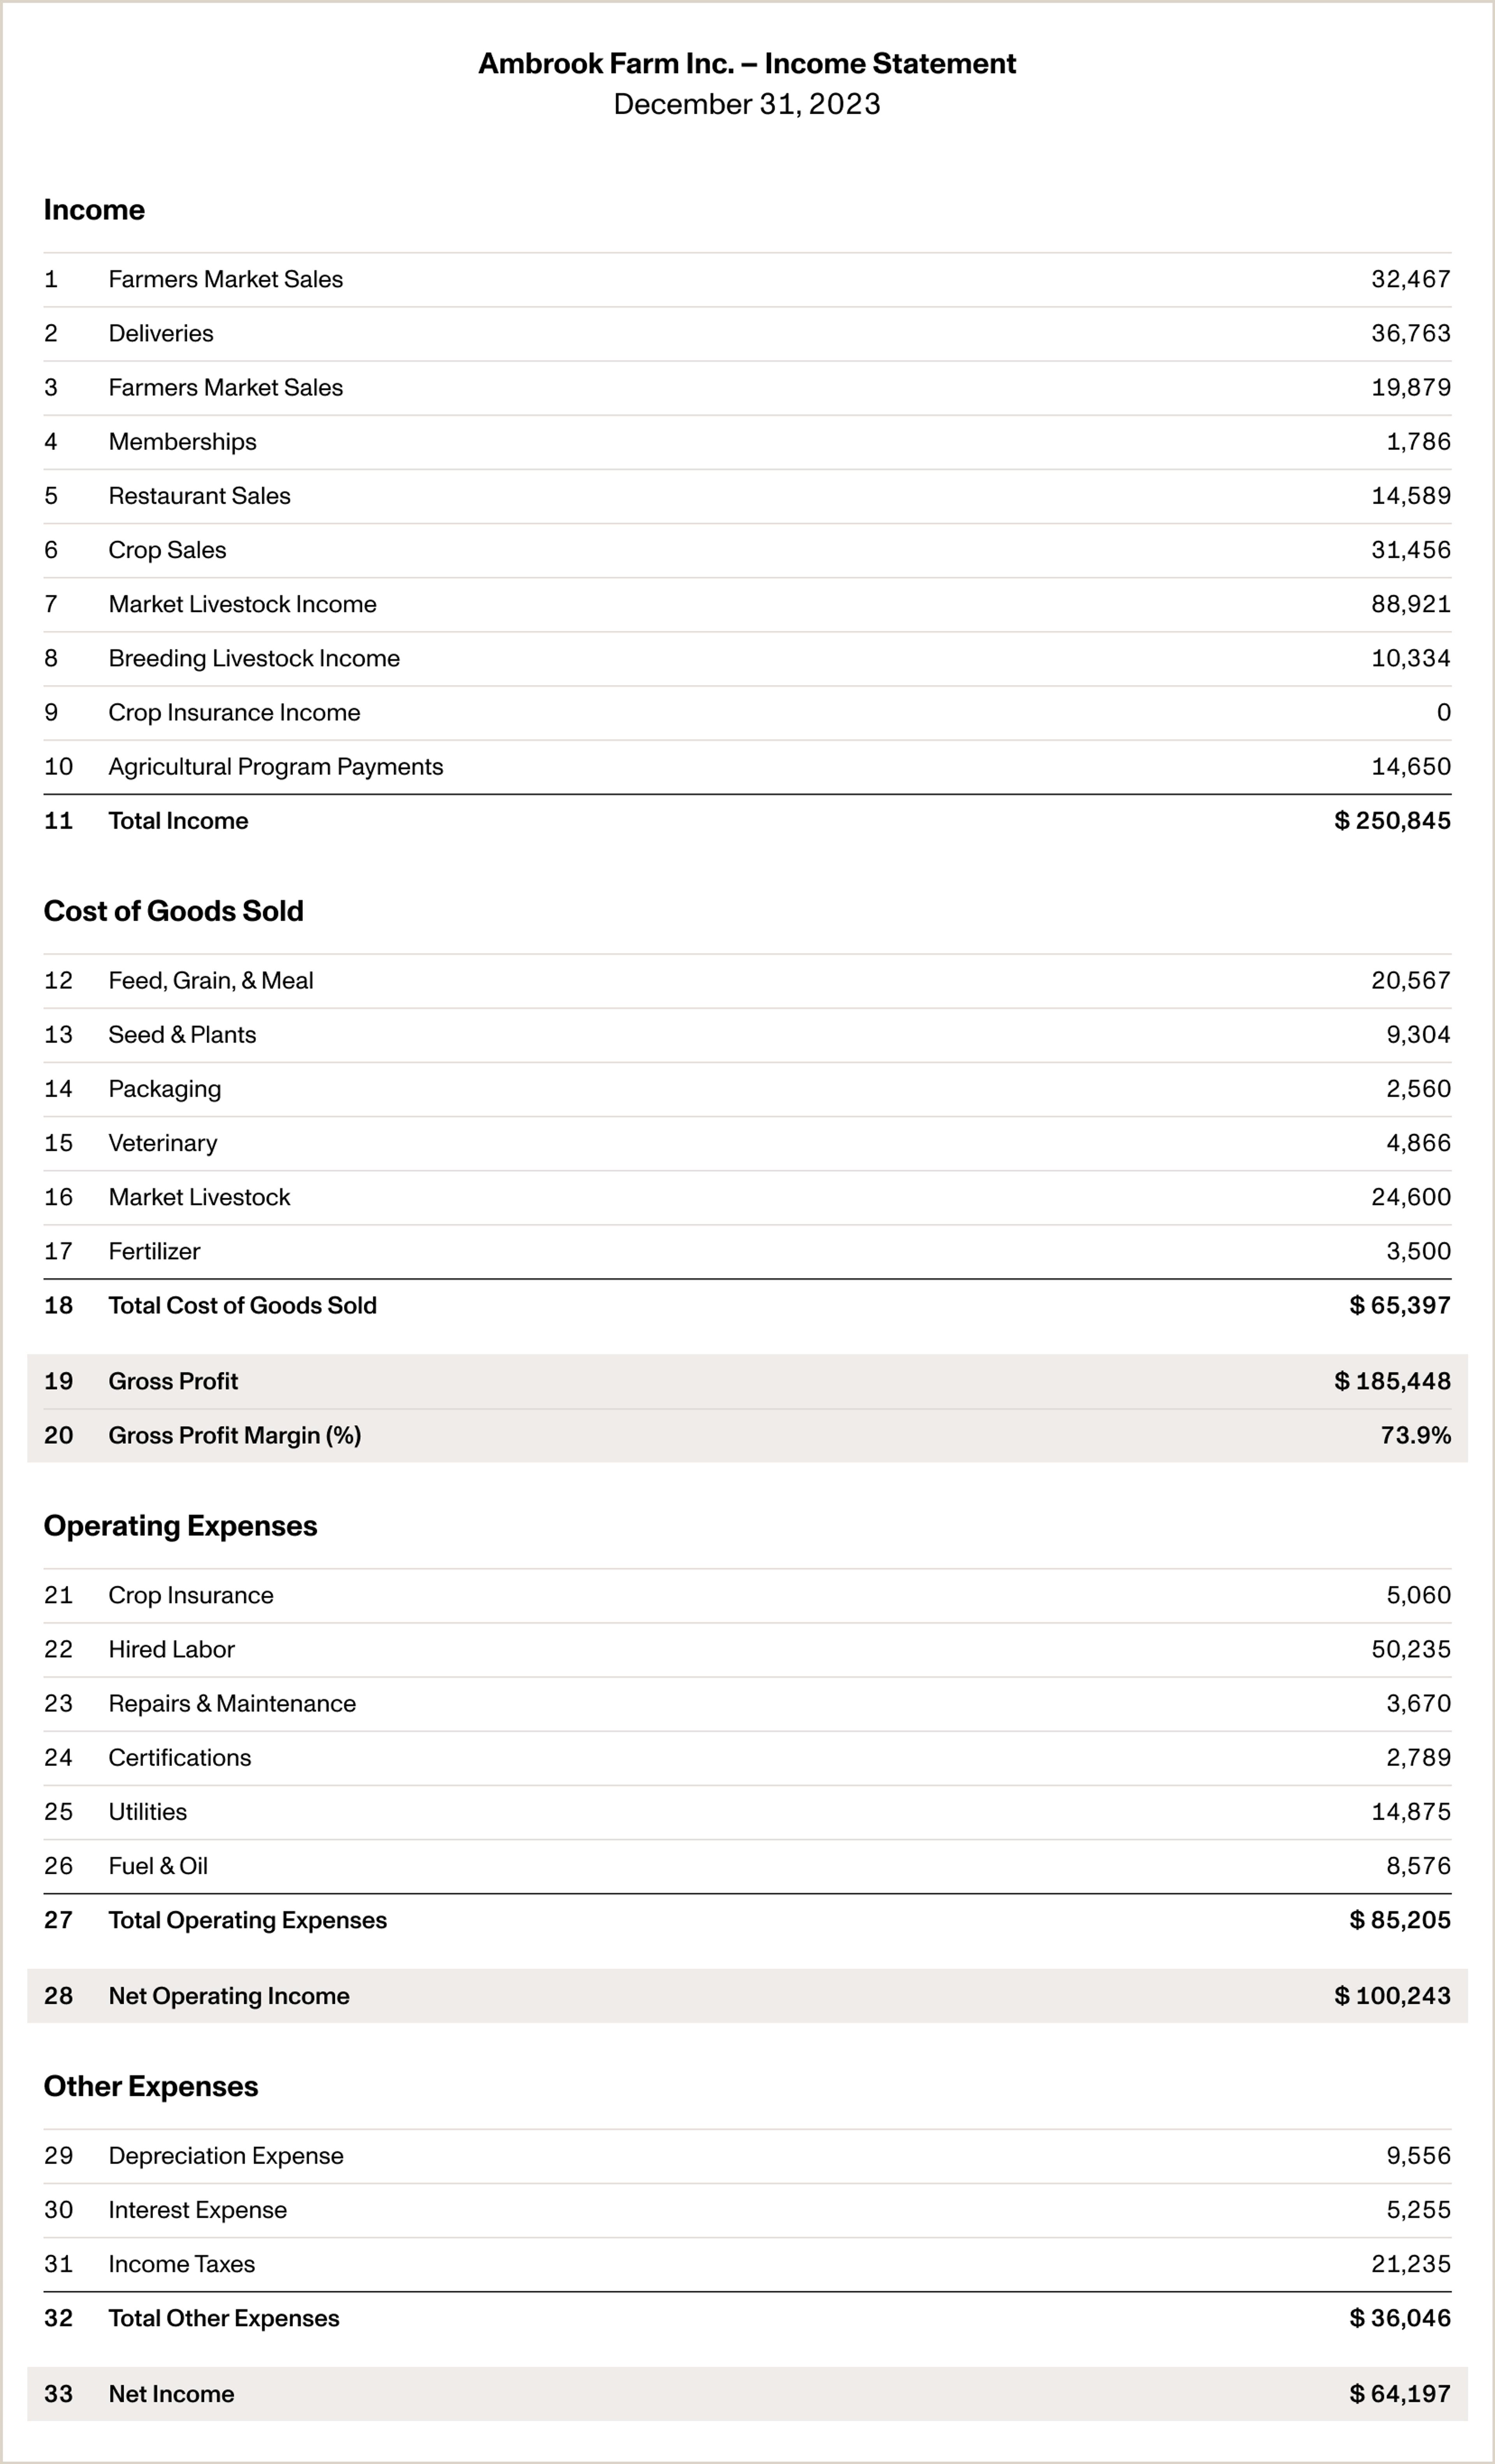
Let’s look at an annual income statement for a fictional business called Ambrook Farm, an agricultural business that produces beef, poultry, pork and produce for sale to distributors, farmer’s markets, CSA boxes, and restaurants:
Reference our income statement example
Let’s read through this income statement section by section and see what we can learn about Ambrook Farm’s profitability from each one:
Income
This is the starting point for every income statement, representing all of your business’ revenues for the relevant period. Income statements group income and expenses together to make them easier to analyze.
On this income statement, everything above the ‘Total Income’ line (22) is a revenue source, and everything that comes after is an expense. As you can see, across all of its income streams, Ambrook Farm earned a total of $250,845 in income for 2023 (Line 22).
Cost of Goods Sold (COGS)
COGS are any expenses your business made that went directly into producing goods or services for sale. For an agricultural business like Ambrook Farm, that means costs like feed and meal, seed, and packaging costs.
COGS are separated from operating expenses (see below), which are expenses that aren’t directly tied to production, like utilities, marketing and administrative costs. If you’re ever unclear about whether an expense qualifies as a COGS, consider whether it’s directly related to producing goods or services for sale.
According to its annual income statement, Ambrook Farm’s total COGS for 2023 was $65,397 (Line 29).
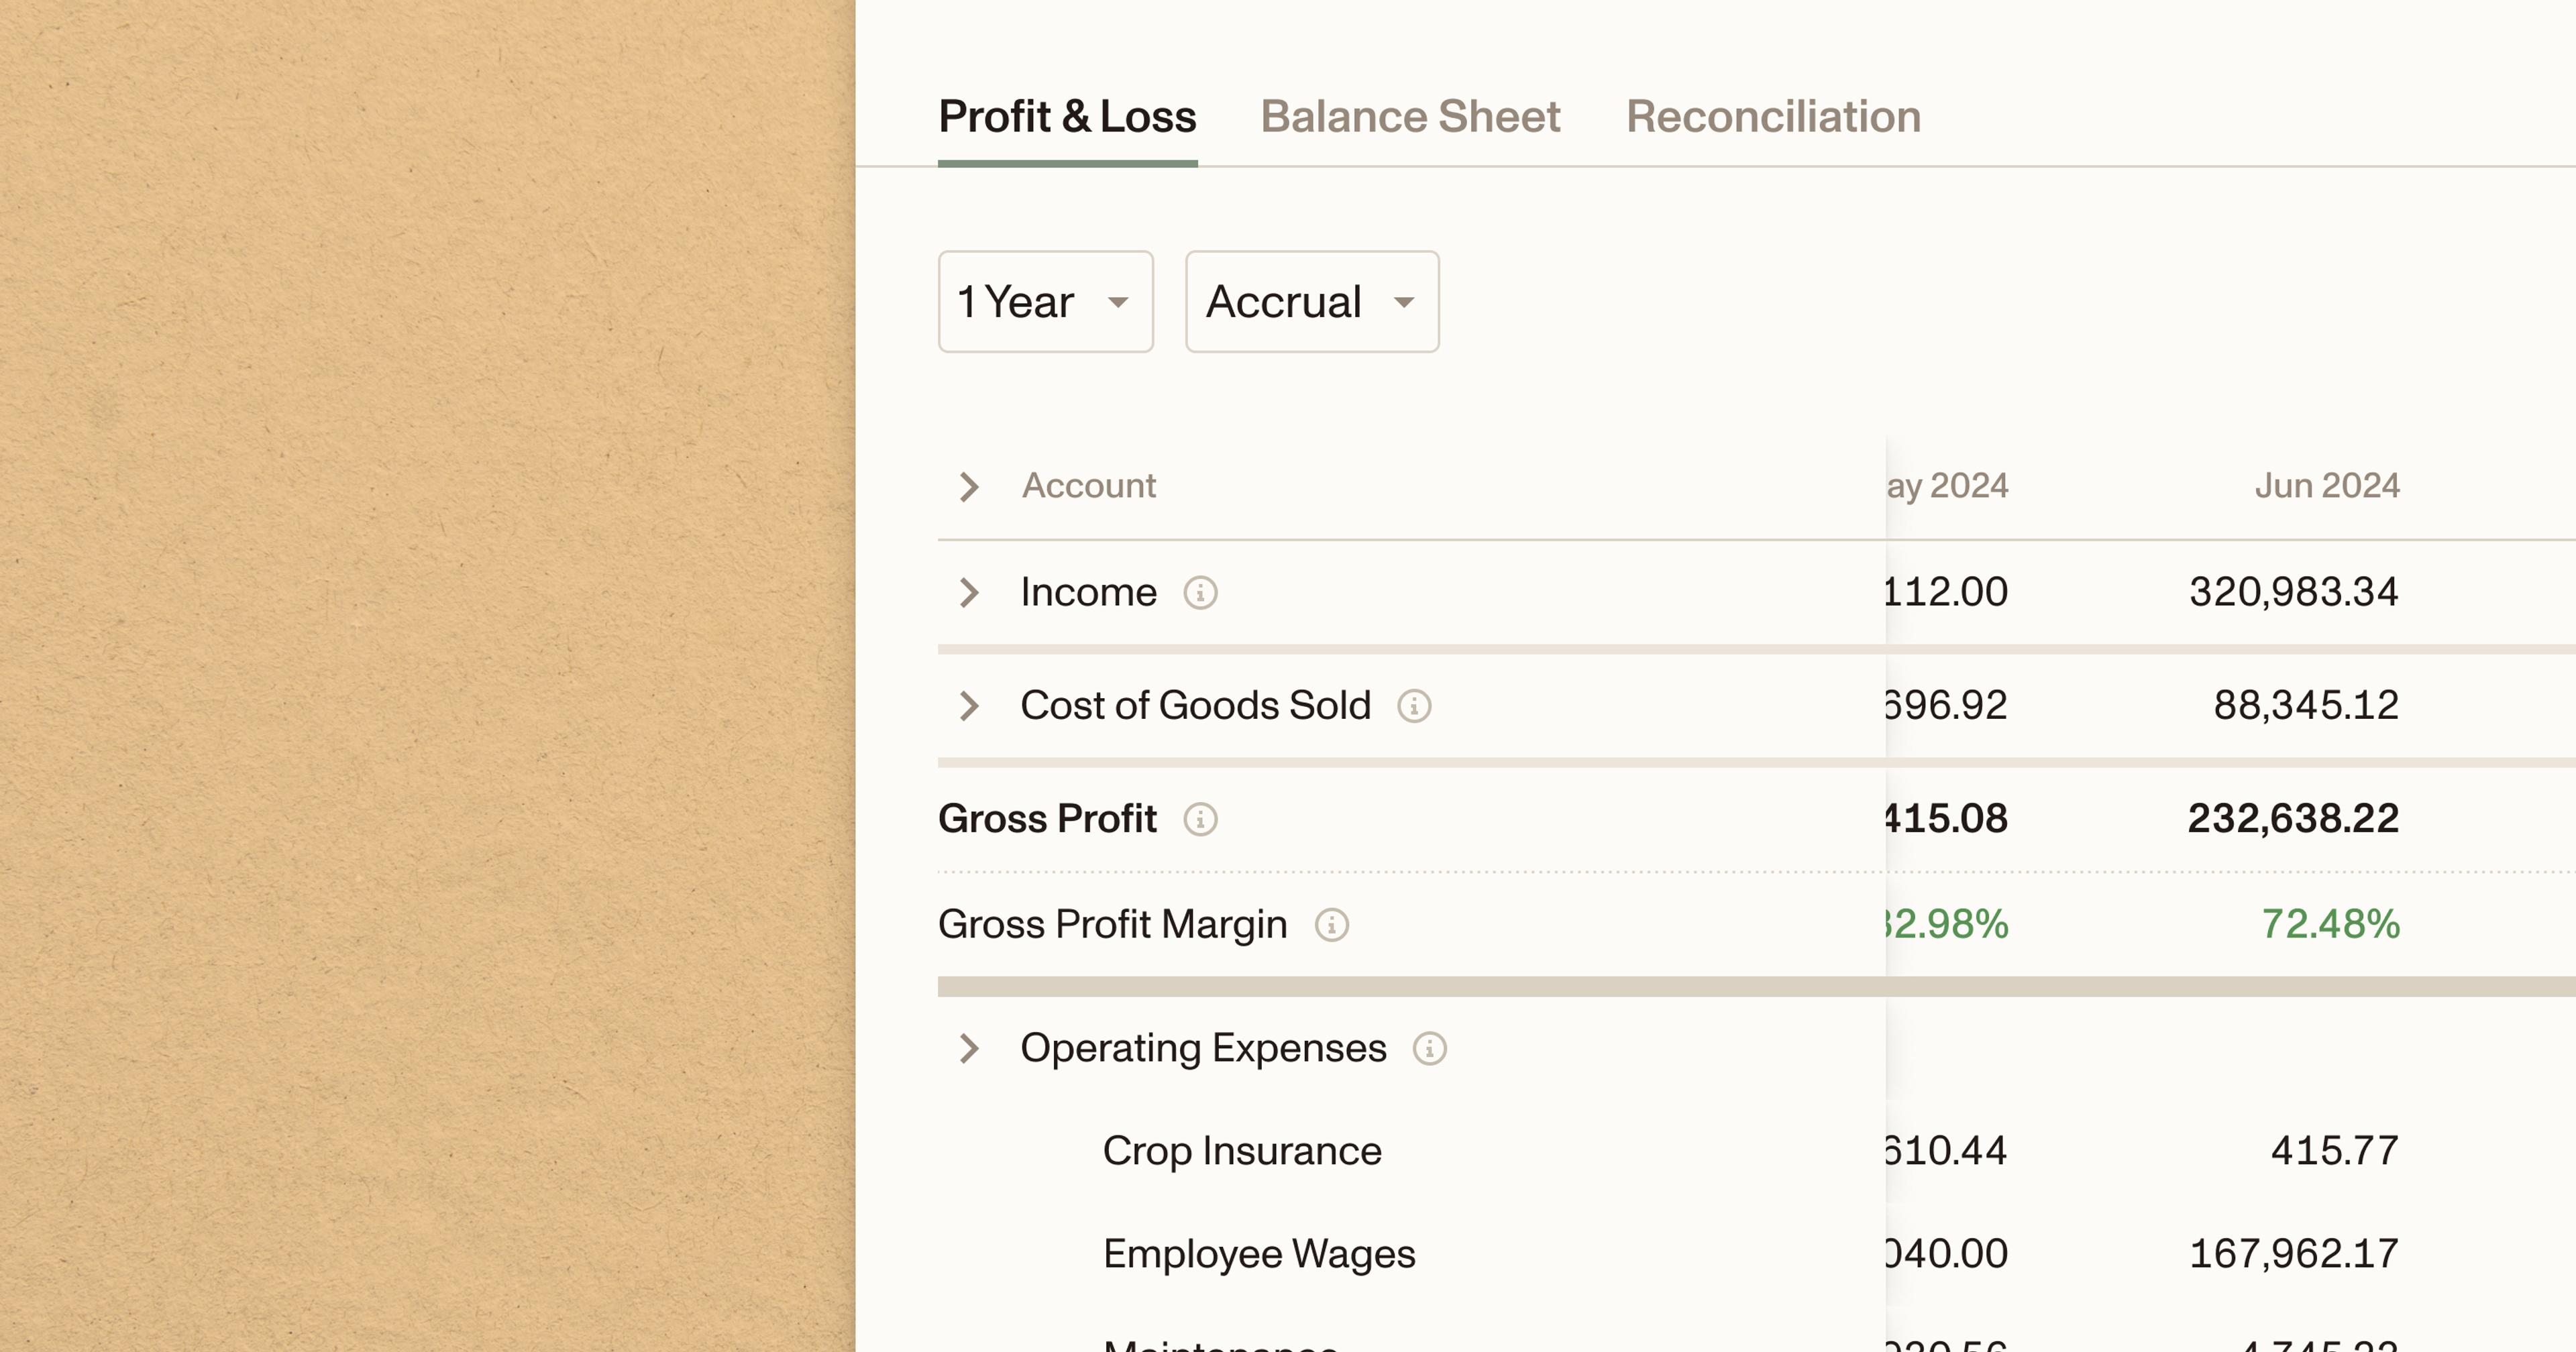
Gross Profit
This is the first measure of profitability you’ll often see on the income statement. Calculated by subtracting COGS from total income, gross profit tells you how much income you have left over to pay for your operating expenses and overhead, which in Ambrook Farm’s case is $185,448 (Line 30).
Gross Margin
We divide gross profit (Line 30) by total income (Line 22) to get gross margin, which is expressed as a percentage and measures how good your business is at turning direct inputs into products.
In Ambrook Farm’s case, that would be:
Gross Profit Margin = Gross Profit / Total Income
Gross Profit Margin = $185,448 / $250,845
Gross Profit Margin = 73.9%
Financial ratios are used to compare a business‘ financials to other similar businesses in similar industries, and we can use Ambrook Farm’s gross margin to benchmark their operation. In agriculture, a gross profit margin of 65% or higher is generally considered healthy, and Ambrook Farm’s 73.9% more than clears that benchmark.
Operating Expenses
These are expenses that don’t fall under COGS but still need to be paid for the business to continue operating, including utility bills, repairs and maintenance, and fuel costs. Ambrook Farm’s total operating expenses for 2023 were $85,205 (Line 38).
Some income statements might further subdivide operating expenses into ‘direct’ and ‘indirect’ operating expenses. Direct expenses can be tied back to a particular enterprise or line of business, like poultry, beef, or an individual crop, while indirect expenses are shared by multiple products or the whole business, and usually include overhead costs like marketing, sales, and administrative costs.
Net Operating Income
This is what’s left over once you subtract all of your businesses‘ internal costs – i.e. operating expenses and COGS – from total income, and represents the part of your profit that your business has control over. (Some income statements will refer to this as earnings before interest, taxes, depreciation and amortization, or ‘EBITDA.’) For 2023, Ambrook Farm’s net operating income was $100,243 (Line 39).
Interest, Taxes, Depreciation and Amortization
The final expense category on the income statement includes interest, taxes, depreciation and amortization, which on this income statement we refer to as “other expenses.”
These come last on the income statement because they’re external expenses that your business has the least control over. For 2023, Ambrook Farm’s other expenses totaled $36,046 (Line 43).
Net Income
When accountants talk about the ‘bottom line,’ this is the line they’re talking about: net income (Line 44). This represents your businesses total profit or loss for that specific accounting period. Ambrook Farm’s net income for 2023 was $64,197.
Important Income Statement Calculations
Once you’ve assembled an income statement and calculated gross profit, net operating income and net income, there are a few financial ratios you can calculate and use to benchmark your business against other similar businesses.
Rate of return on assets
The rate of return on assets measures how good a business is at using their assets to turn a profit. To calculate it, we use the following formula:
Rate of return on assets = Net income / Average total assets
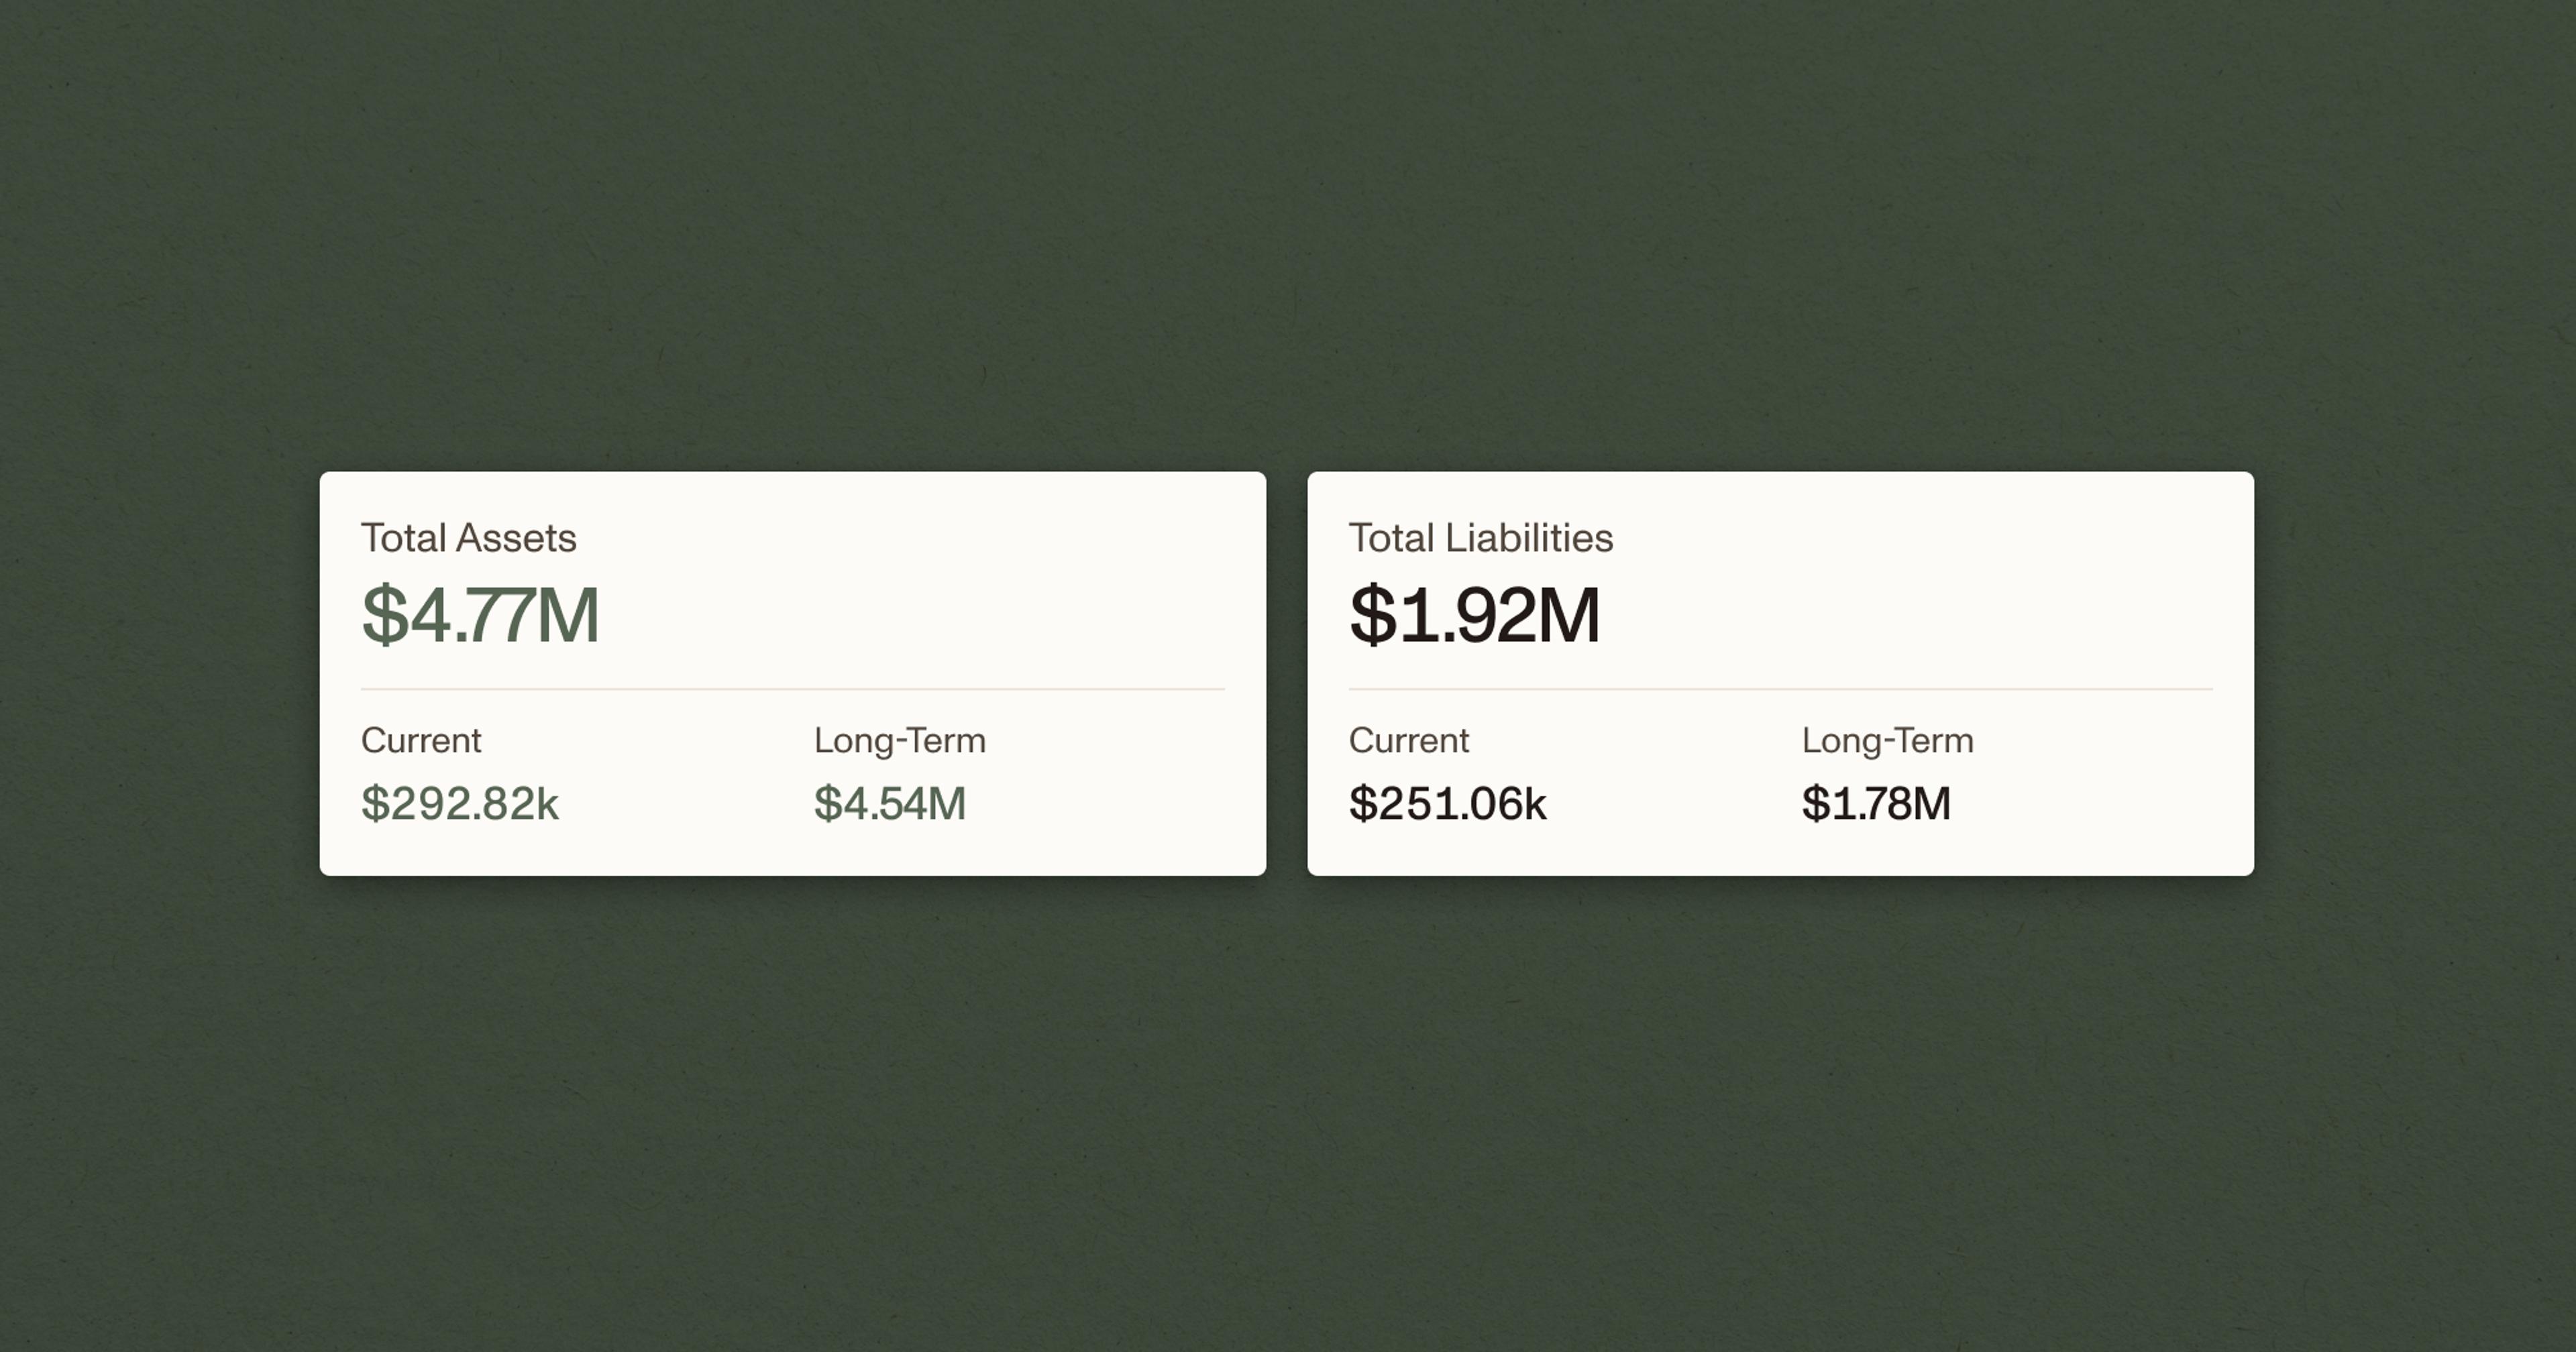
Note that the total asset figure from Ambrook Farm’s 2023 balance sheet tells us what their assets were valued at a single point in time (Dec. 31, 2023), which is different from their average value, which we can calculate by averaging the beginning and ending total asset balances for 2023.
Let’s say that the average value of Ambrook Farm’s total assets in 2023 was $1,034,223. Substituting in the values from Ambrook Farm’s income statement, we get:
Rate of return on assets = $64,197 / $1,034,223
Rate of return on assets = 6.2%
In the year 2023, Ambrook Farm had a 6.2% rate of return on its assets. According to the University of Minnesota’s Farm Financial Scorecard (FFS), a ratio of below 4% is considered weak for agricultural businesses, and anything above 8% is strong, putting Ambrook Farm solidly in the middle of the pack.
Rate of return on equity
Another important ratio we can calculate is the rate of return on equity, which measures how fast a business’ equity is growing and uses the following formula:
Rate of return on equity = Net income / Average total owner’s equity
Let’s say Ambrook Farm’s average owner’s equity for 2023 was $622,324. Substituting those values into the equation, we get:
Rate of return on equity = $64,197 / $622,324
Rate of return on equity = 10.3%
The FFS suggests that for agricultural businesses, anything below 3% is weak and anything above 10% is strong, which means Ambrook Farm’s equity is growing at a strong rate.
Operating profit margin
One more ratio to consider is the operating profit margin, which is similar to the gross profit margin we calculated earlier. The difference is that the operating profit margin also factors in operating expenses, and tells us about how good a business is at managing and controlling those expenses. The formula we use to calculate it is:
Operating margin = Net Operating Income / Total Income
Substituting the values from Ambrook Farm’s income statement, we get:
Operating margin = $100,243 / $250,845
Operating margin = 40%
The Farm Scorecard tells us that for businesses similar to Ambrook Farm, anything below 15% is weak, while anything above 25% is good. With an operating margin of 40%, we can conclude that Ambrook Farm is doing a good job at managing its operating costs compared to other similar businesses.
Segmented income statements
‘Enterprise-level’ income statements capture total business revenues and expenses, but you can also generate segmented income statements for individual segments of your business to get a sense of their individual profitability.
COGS, gross profit, gross margin and all of the ratios we calculated above are powerful ways to measure the profitability of a business overall, but combined with segmented income statements they can also tell you a lot about the profitability of individual business units and product lines.
For example, a business like Ambrook Farm might generate separate income statements for different animal groups or goods, or for different properties if they own multiple farms. Doing so they might find that one has a higher gross margin than the other and decide to shift resources to the more profitable business, or try to cut costs and make the less profitable business more efficient.
How do I generate an income statement for my business?
Tired of stale spreadsheets and pen-and-paper accounting? Ambrook‘s real‑time, interactive reports give you access to the numbers you need to make decisions about your operation.
Coupled with other automatically-generated financial statements, income and expense tracking, effortless tax time prep and other features custom-built for businesses across the American supply chain, Ambrook helps you make better business decisions and get peace of mind.
Need more guidance on your financial statements? Catch up with our “how to” guides on the balance sheet and the statement of cash flows.