At Ambrook we think that one of the most important, and difficult, challenges for producers is measuring the true cost of production. This is the amount that it costs to produce inclusive of direct costs, operating expenses, financing costs, management labor, and so on.
The challenge is three-fold:
You need clear, organized data: both inventory and financials
You need a framework and toolkit to allocate your costs
You need the business context to do your cost analysis
Ambrook’s mission is to make it easier for businesses of all shapes and sizes to measure these production costs. Our people have experience working with many different producer-types and our platform is designed to make record keeping simple yet powerful.
Recently, we worked with one of our customers to analyze the production costs of their cow-calf operation. Specifically, they wanted to know the true cost of raising replacement heifers and yearling steers, so that they could better make decisions about managing the herd and investing in direct-to-consumer channels.
The Process
Understanding the true cost of production for a cow-calf operation required three steps:
Charting the stock flow of the operation to understand how many calves were produced, what the mix of steers vs heifers was, and how to account for any culling that occurred.
Defining a system of enterprise tags to divide the ranch’s financial transactions according to relevant activities.
Allocating the ranch’s activities into the profit and cost centers associated with raising and selling calves.
Our work produced true costs of production for the 2023 crop of yearling steers and replacement heifers. By the end of 2024, the operation will have a benchmark for production costs that can be used for year-over-year comparison, as well as for decision making about how much to invest in direct-to-consumer channels.
Using real, anonymized data, with the permission of our customer, this case study will walk you through the process we took so you can do the same for your operation.
Background
The ranch is a cow-calf operation with about 9,000 acres of grazing pasture in California. The activity is a mix of custom grazing and wholly-owned, raised animals, depending on the year. They make money from custom grazing income, sales of yearling steers at the local auction, and through direct, private sales of both raised and purchased animals, grass and grain finished.
Measuring the cost of production for raised livestock presents a unique challenge in terms of how to track accumulated costs across fiscal years. For a yearling steer, born in January of a given year, it is often not sold until 18 months after birth. Heifer calves are not formally transferred into the breeding herd until almost two (2) years after birth. Over that time period, the operation is also running both the Direct Sales and Custom Grazing businesses, incurring a number of expenses for both of those enterprises.
Stock Flow
This particular operation currently manages their herd using CattleMax, a software designed for herd and pasture management. Within this software they are able to record the dates that calves were born as well as the dates replacement heifers become bred (and are transferred to the breeding stock). Additionally, they can track cattle sales to identify the dates that yearling steers or culled cows were sold.
Our team worked with the operation to produce the following stock flow report:
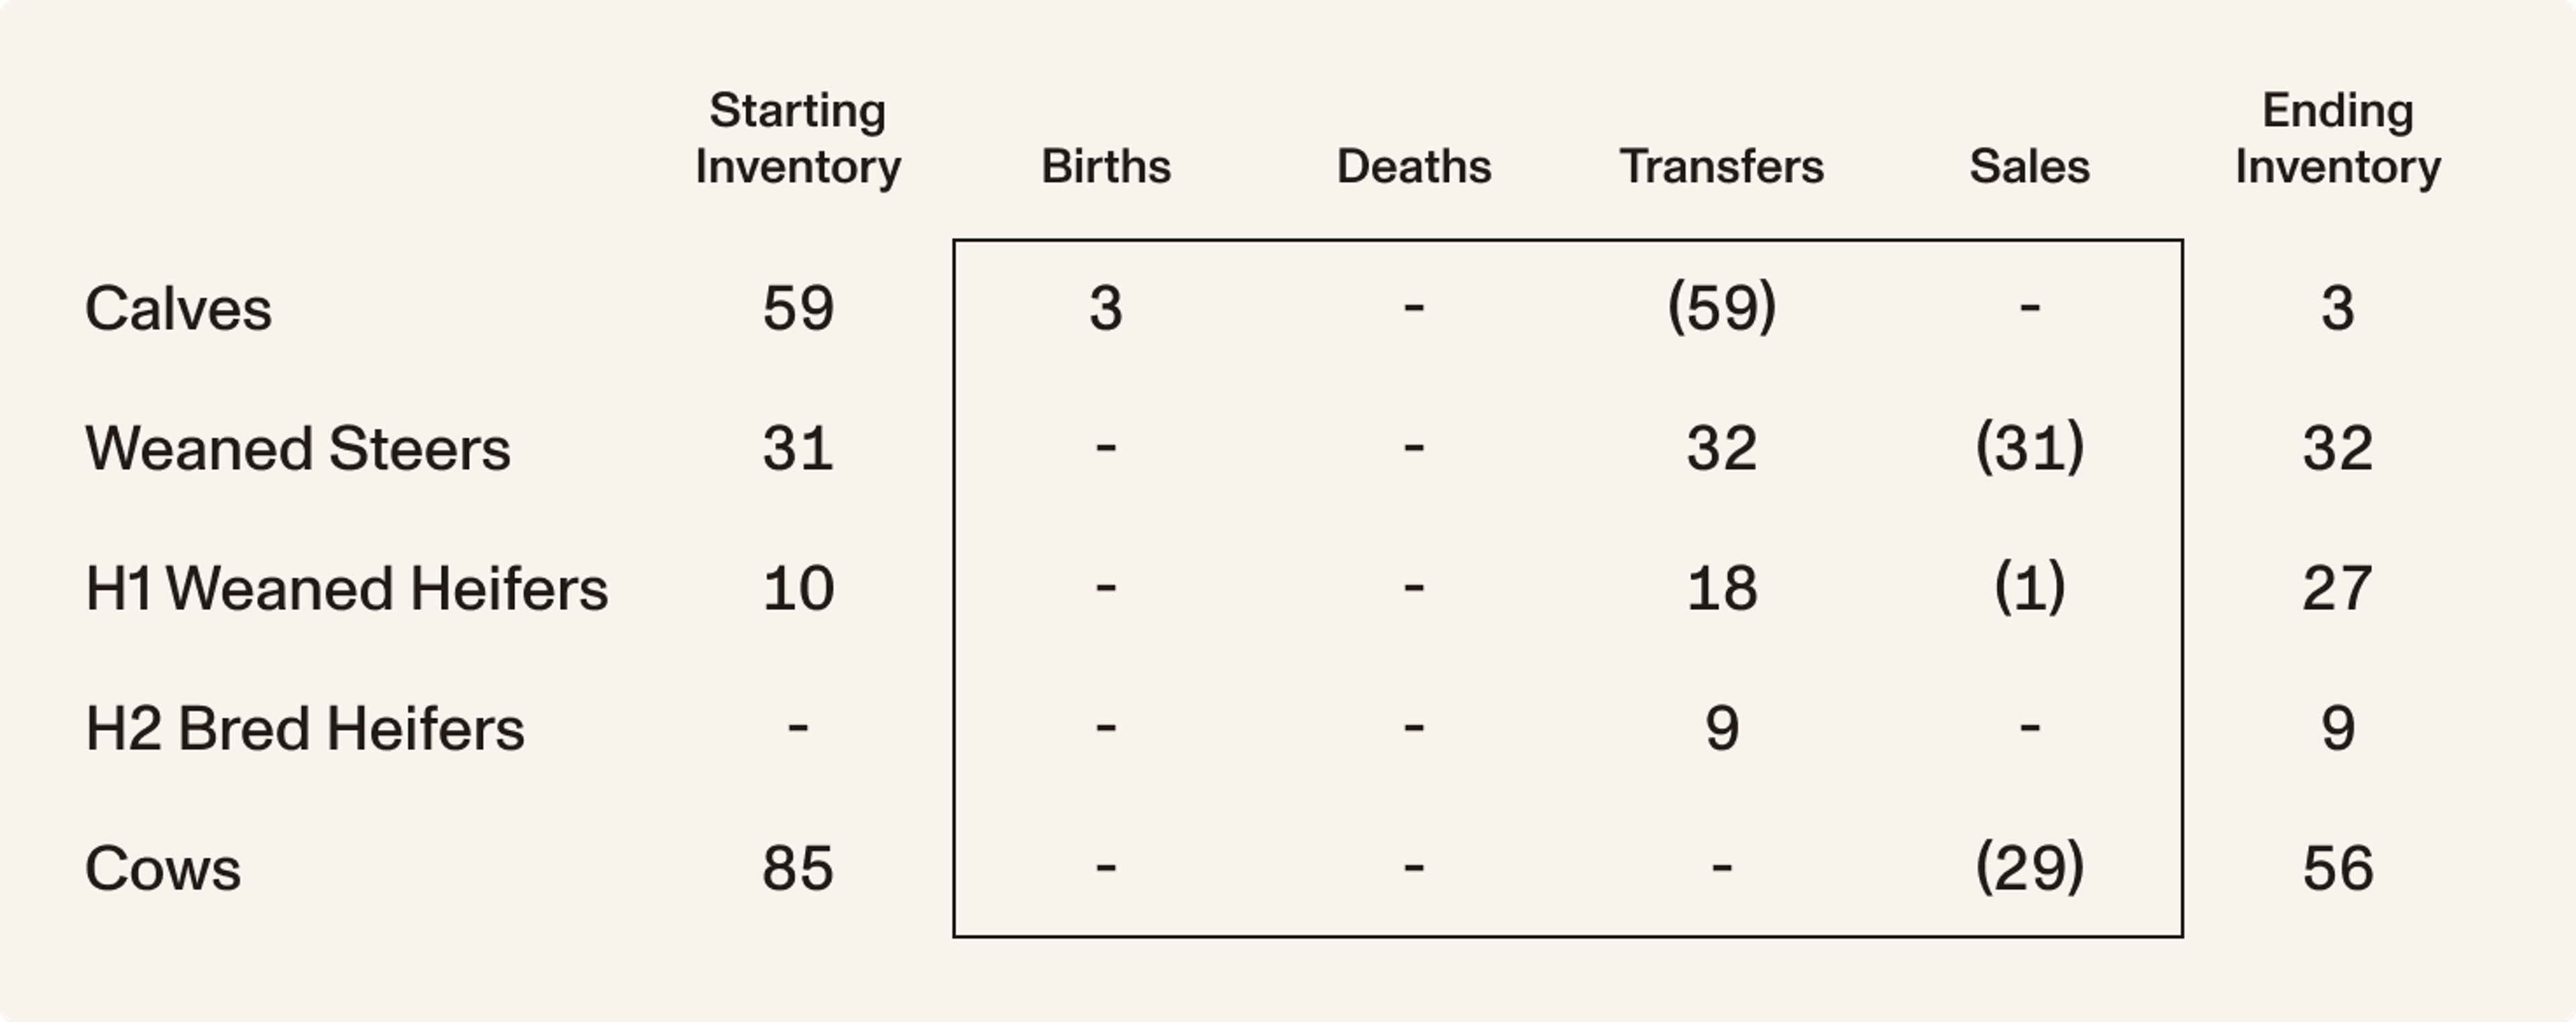
Doing this piece of work unlocks two important pieces of information:
The ratio of steers to heifers produced in 2023 informs how 2023 expenses should be allocated.
Tracking the change in breeding stock (bred heifers and cows) informs the accrual adjusted entry for “Change in Value of Breeding Stock” that the operation will allocate to its cow-calf enterprise. We used the Base Value methodology which you can learn more about here.
Enterprise Structure
Ambrook is unique in the way we emphasize the use of enterprise tags in record keeping. We worked with this operation to design an enterprise tagging system that represents the full breadth of the operation.
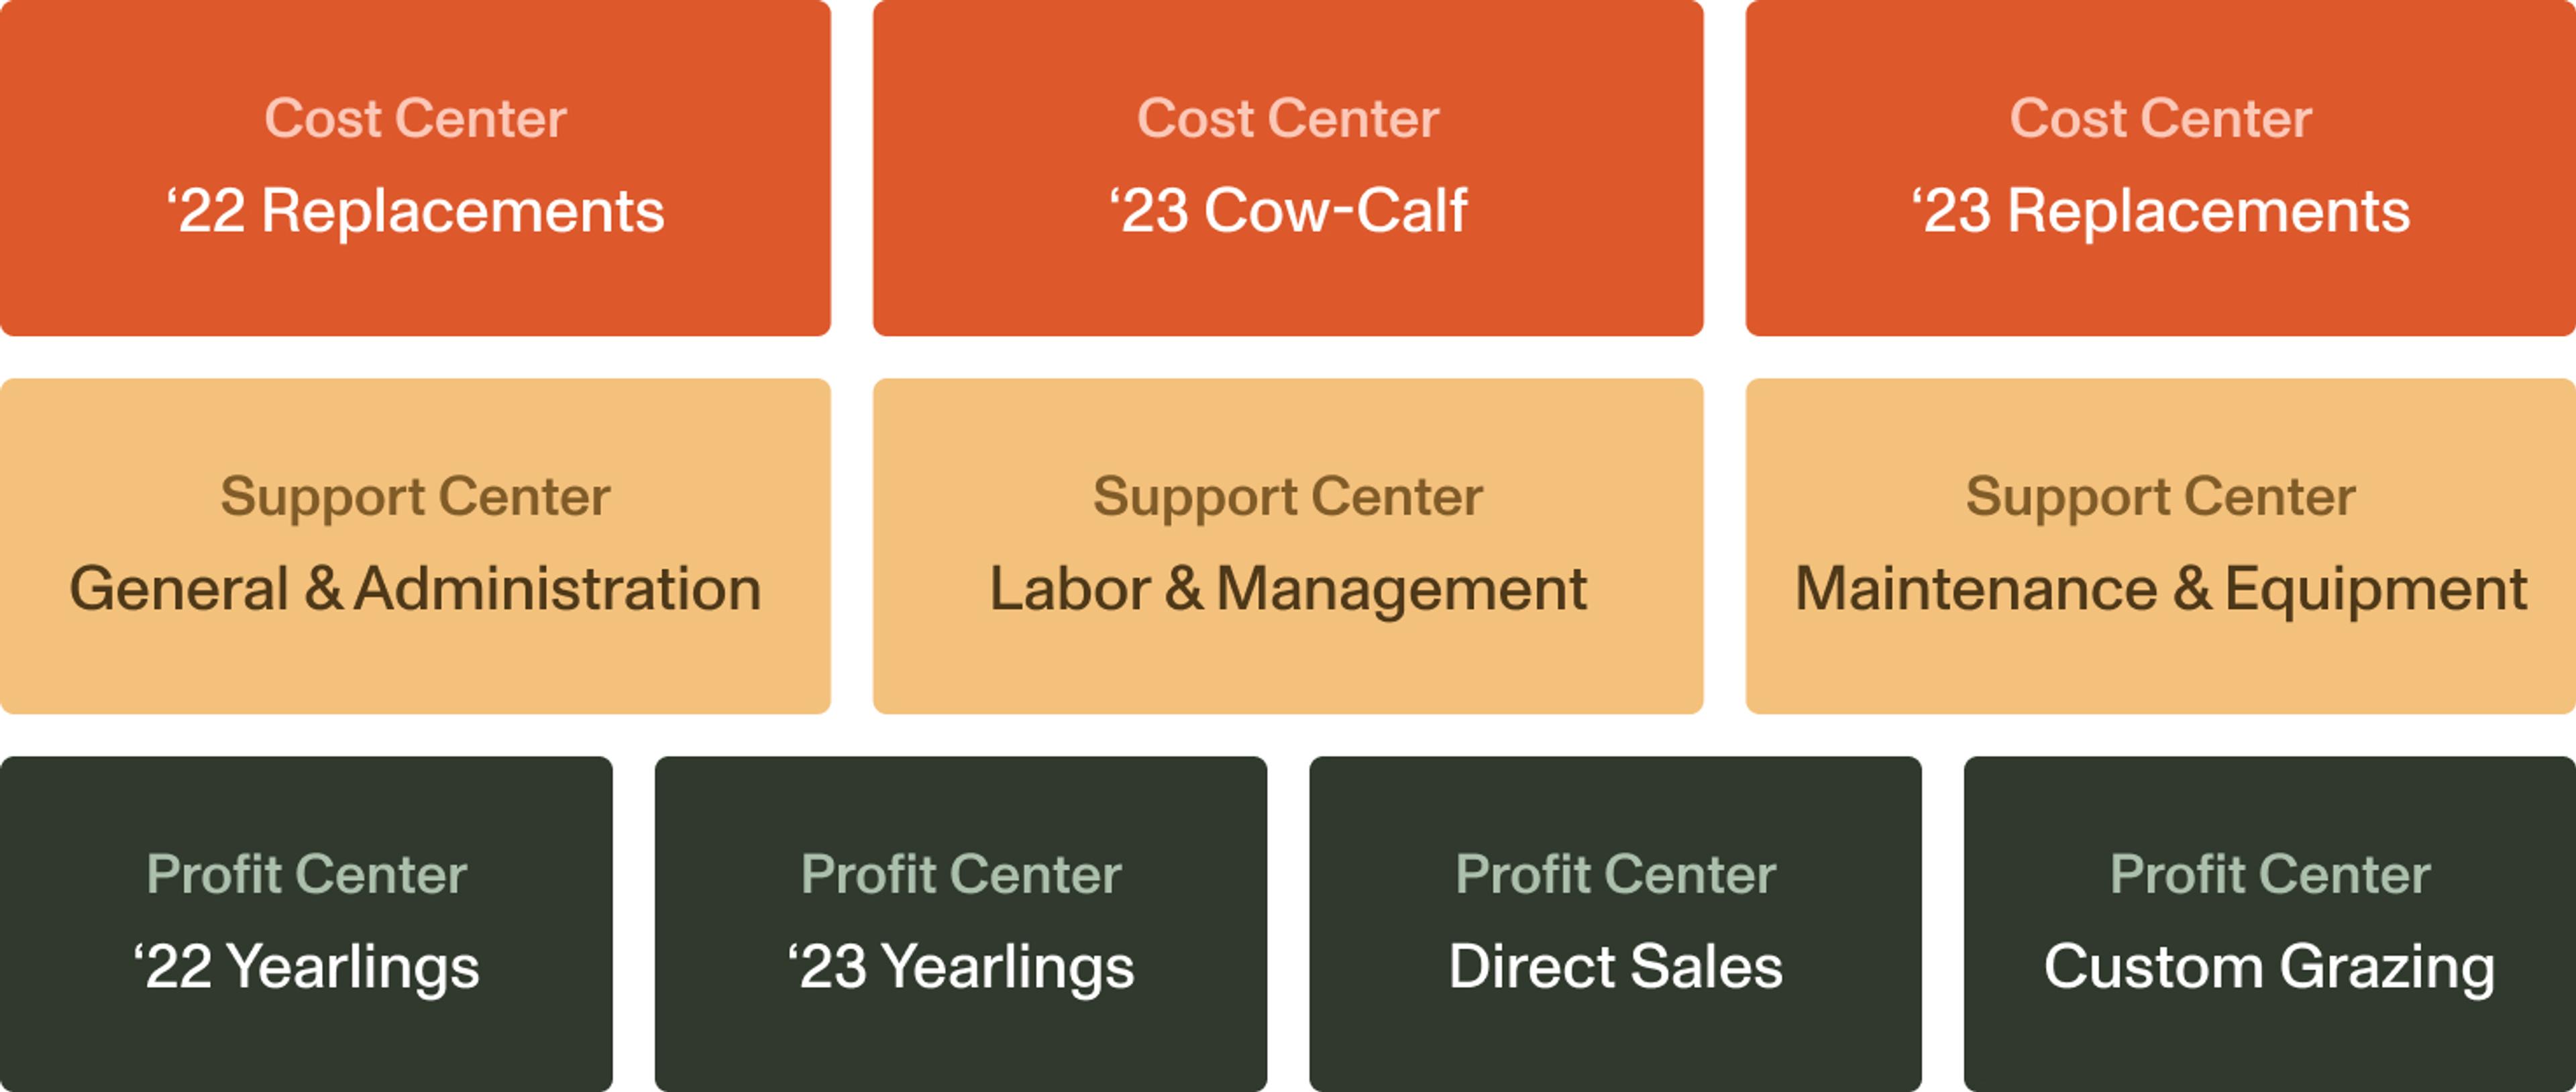
At a high level, enterprise tags correspond to business activity. There are three main types of enterprises that an operation might have:
Support Centers: The fixed costs of an operation that occur no matter what, such as labor, repairs, interest expenses, and general & administrative.
Cost Centers: The activities of an operation that accumulate expenses but don’t directly turn into profits, such as the raising of replacement heifers. These centers often are transferred into balance sheet accounts once finished.
Profit Centers: The activities as an operation that generate profit.
We used Ambrook’s financial statement and bulk tagging tools to go through the 2023 financials and allocate all the transactions according to the following enterprise framework.
Allocations
With the stock flow established and the 2023 books categorized by enterprise, we were able to allocate expenses. This first step in this process required estimating the percentage of each support center that needed to be allocated to either cost or profit centers. For this particular operation the allocation percentages were as follows:
| Profit & Cost Centers | General & Administrative | Labor & Management | Machinary & Equipment |
|---|---|---|---|
| '22 Replacement Heifers | 6.0% | 6.0% | 6.0% |
| '22 Yearling Steers | 2.5% | 2.5% | 2.5% |
| Direct Sales | 0.0% | 0.0% | 0.0% |
| Custom Grazing | 7.5% | 7.5% | 7.5% |
| 2023 Cow-Calf | 84% | 82.5% | 84% |
Unsurprisingly, the 2023 cow-calf operation received a large bulk of the expense allocations for the year. The 2022 yearlings were sold off in Q1 2023 and the number of replacement heifers was relatively small as a percentage of total herd size, but making these allocations is still an essential step in getting accurate figures. Using Ambrook’s internal transfers, we are able to easily allocate the expenses of these support centers into the buckets outlined above.
Once the support centers have been allocated, the final step for calculating cost of production is allocating net income from the 2023 Cow-Calf enterprise. Effectively this enterprise captures all activity on the ranch in 2023 that was attributable to the care of the cow-calf pairs for that year, so it excludes activity caring for the 2022 yearlings and heifers. With that in mind, we determine how to allocate the Cow-Calf enterprise based on the make-up of the calf crop:
| 2023 Cow-Calf — Steer & Heifer Allocations | ||
|---|---|---|
| Total Calves Weaned | 59 | |
| Yearling Steers | 32 | 54.2% |
| Replacement Heifers | 27 | 45.8% |
Results
Our work with this customer enabled them to have a true, holistic sense of their cost of production for the first time.
The 12 month accumulated cost on a steer calf was found to be about $180 cwt. As of the time of this writing, the market price of yearling steers is about $225 cwt, so there is a strong margin of safety there. Knowing this can help provide some peace of mind when determining how many breeding cows to keep next year.
The 12 month accumulated cost of a replacement heifer was found to be about $900 per head. All-in, we estimate the cost of a pregnant bred heifer to be closer to $1,600 per head. As of the time of this writing the market price for bred heifers is above $2,400. Bred heifers will have a 5-7 year useful life of producing cows, so even though the margin is high today it’s not a given that the operation should be selling their replacement heifers.
When a heifer or steer is marketed directly - sold by the half, quarter, or pound - it can fetch total revenues of $3,500 to $4,500 depending on the cut. Growing these sales channels does take investment, but it’s crucial to know that the gross margin per animal here can be 60% plus.
Ultimately, market prices changes and pursuing different profit strategies have risks, but the cost of these animals is undoubtedly the most important factor in decision making. With this information, and an opinion about future pricing, an operation can pick a direction with confidence.
In addition to profitability, our work with this customer unlocks a number of operational KPIs that Ranch KPI recommends tracking such as the ranch weaning percentage and the total expenses incurred per weaned calf. As the operation uses Ambrook to continue managing their finances in this way, those numbers will become powerful benchmarks to assess ranch performance.