

At Ambrook, we’re building a comprehensive financial management system for farmers — the stewards of our most vital natural resources. As a product for farmers across the United States, we’re serving a customer base constantly on the move, using network connections of varying quality on a wide array of devices. Our customers trust us with their operations, and we have an obligation to provide a product that lives up to their expectations. And when it comes to financial software, performance and reliability are non-negotiable.
Incidents of inconsistent or delayed data or slow interactions across our web and native applications can impact customer trust. To gain better visibility beyond basic metrics and ensure the reliability our expanding user base expects, we chose to adopt OpenTelemetry for full tracing of our platform.
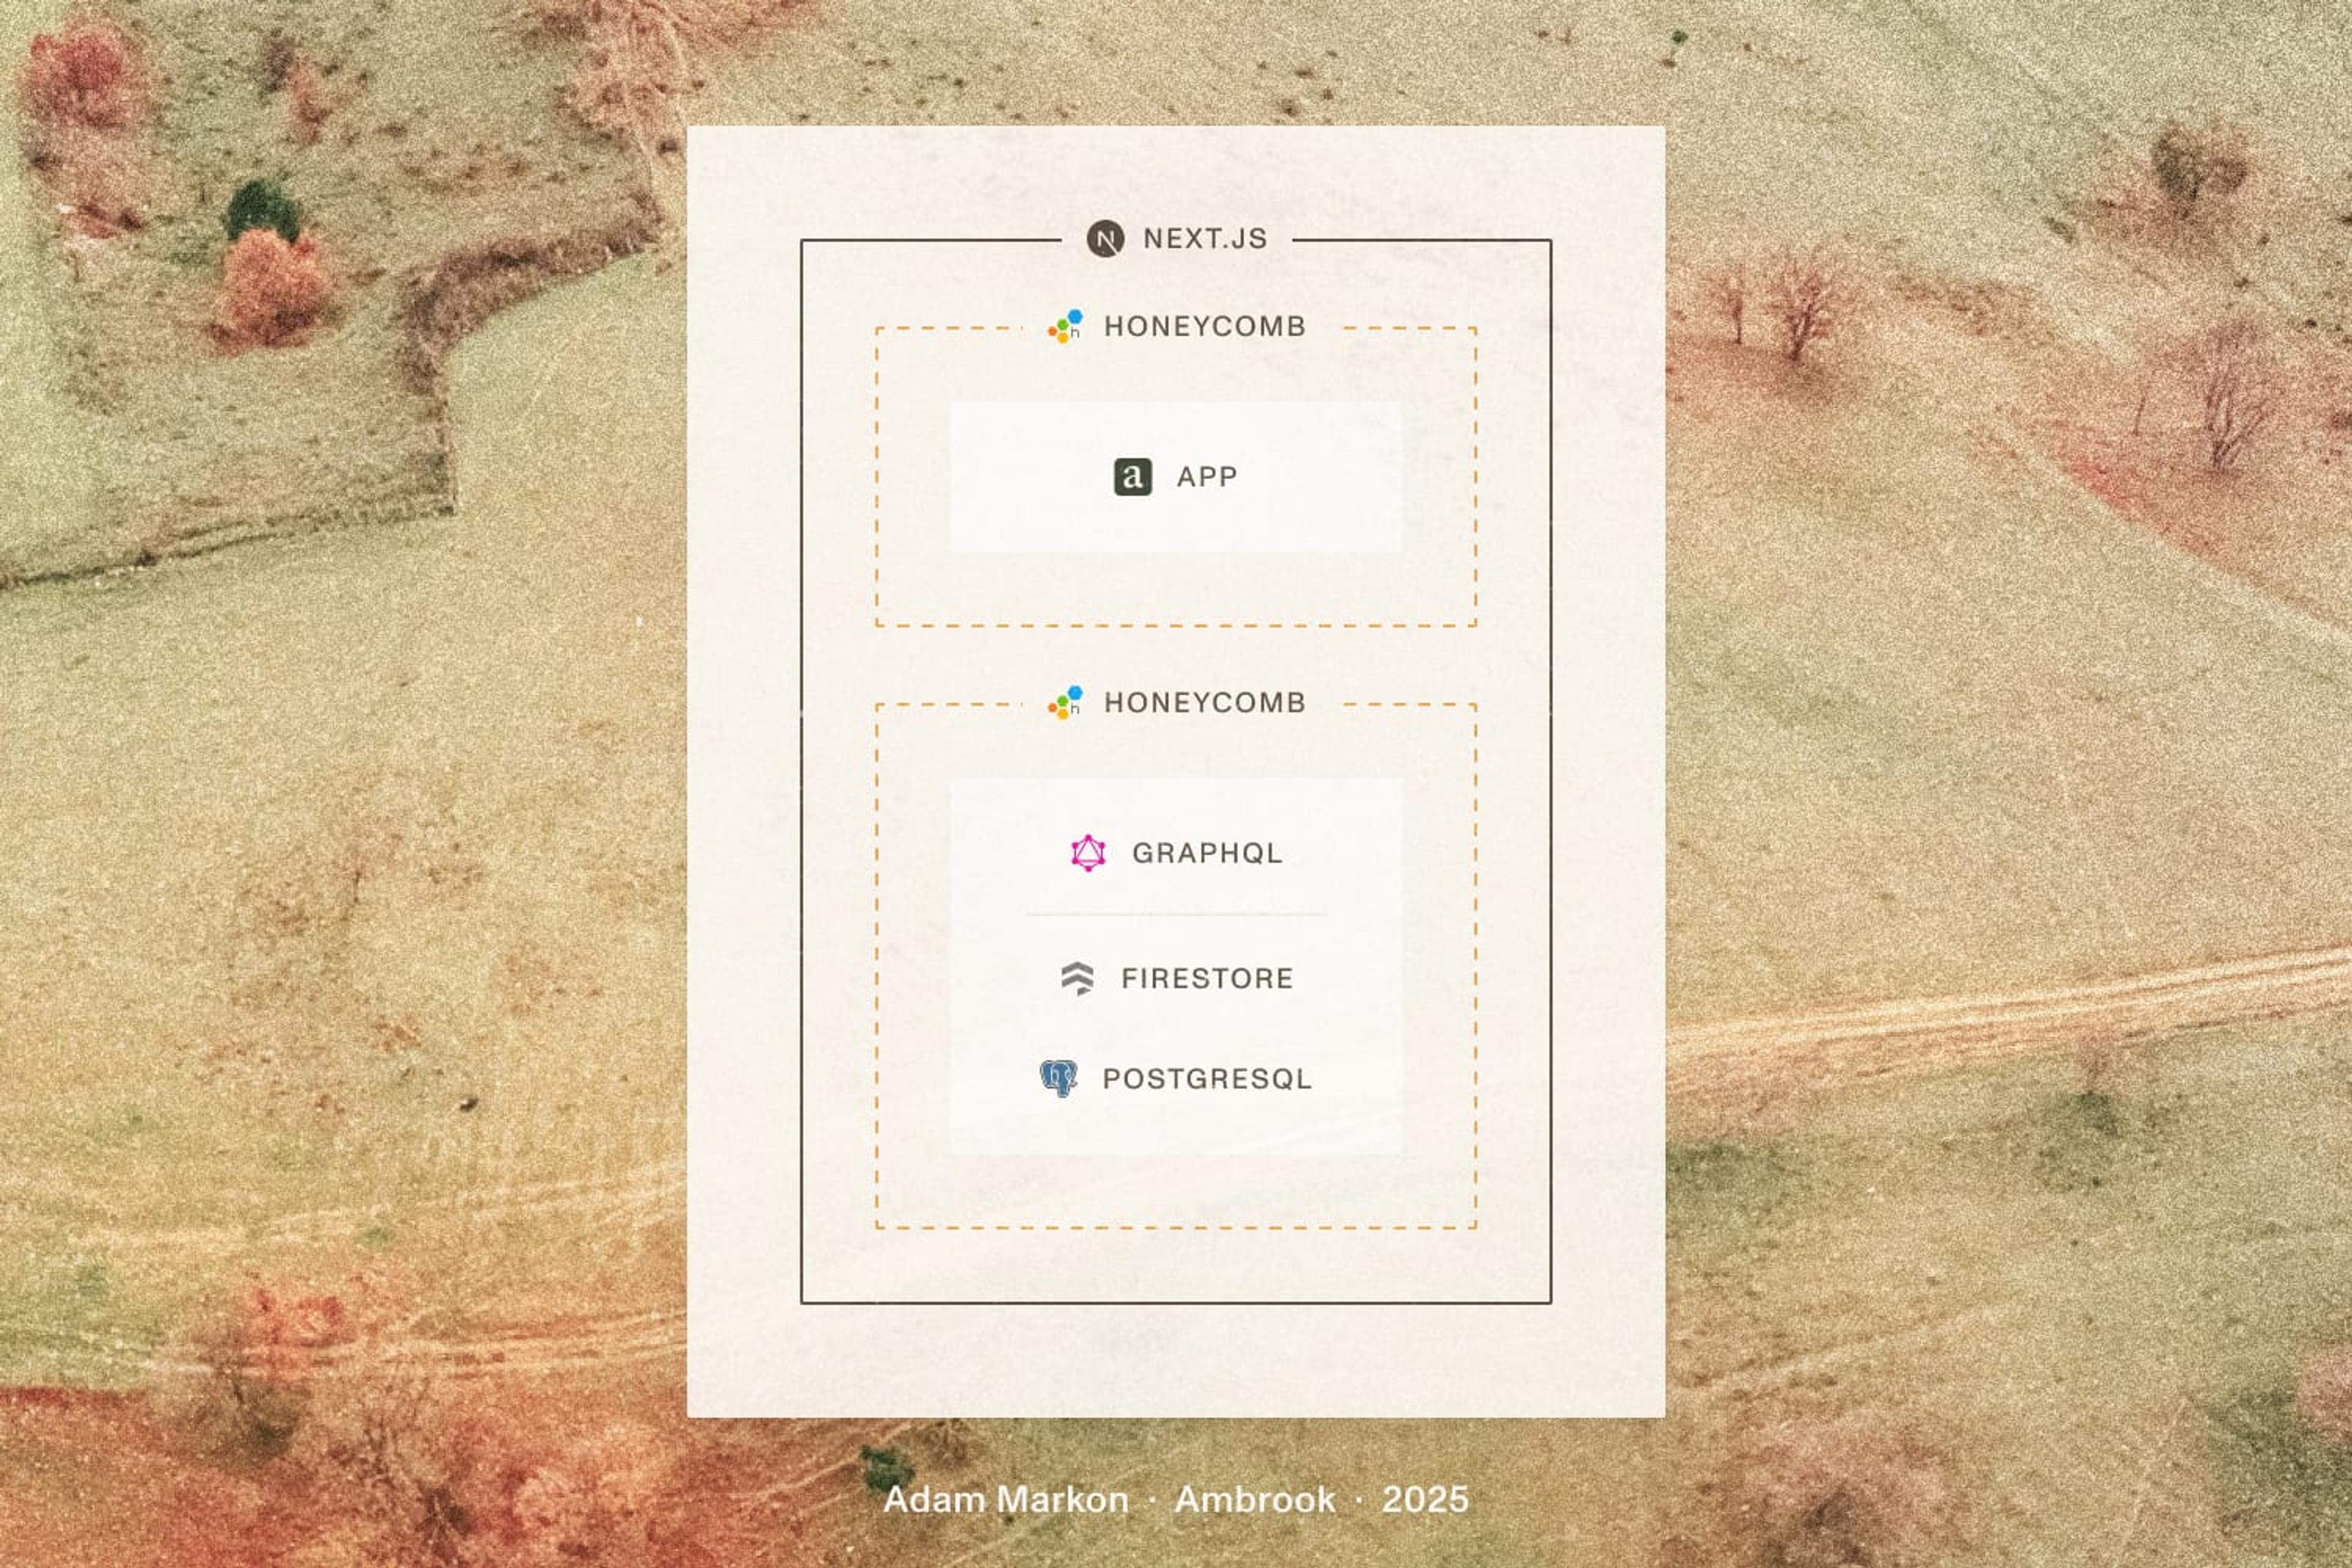
Ambrook’s systems are entirely in TypeScript, and rely heavily on open-source software. Our application is a Next.js monolith, and to support our React Native mobile app we serve all data to clients via a GraphQL API, powered by Apollo Server. Our data primarily lives in Firestore, though we’re in the process of migrating to PostgreSQL. This stack serves us well, and we had hoped that being built on open-source, battle-tested technologies would ease our tracing implementation.
Ultimately this was less straightforward than we had hoped; we encountered a number of challenges building out our tracing data. However, overcoming these challenges allowed us to improve the performance of our application by 30%, giving our customers a responsive experience they can trust.
Challenge #1: Instrumenting Apollo Server
Once we instrumented basic request tracing with the @opentelemetry/auto-instrumentations-node package, the next challenge was instrumenting Apollo Server. While OpenTelemetry has a GraphQL auto-instrumentation, when deployed in production our GraphQL tracing data had disappeared.
This particular auto-instrumentation patches specific JS files in the graphql npm package, which are not available in production because Next.js bundles our backend code into optimized bundles. Thus, the specific files in that package are not available in the filesystem and no GraphQL operations were instrumented properly.
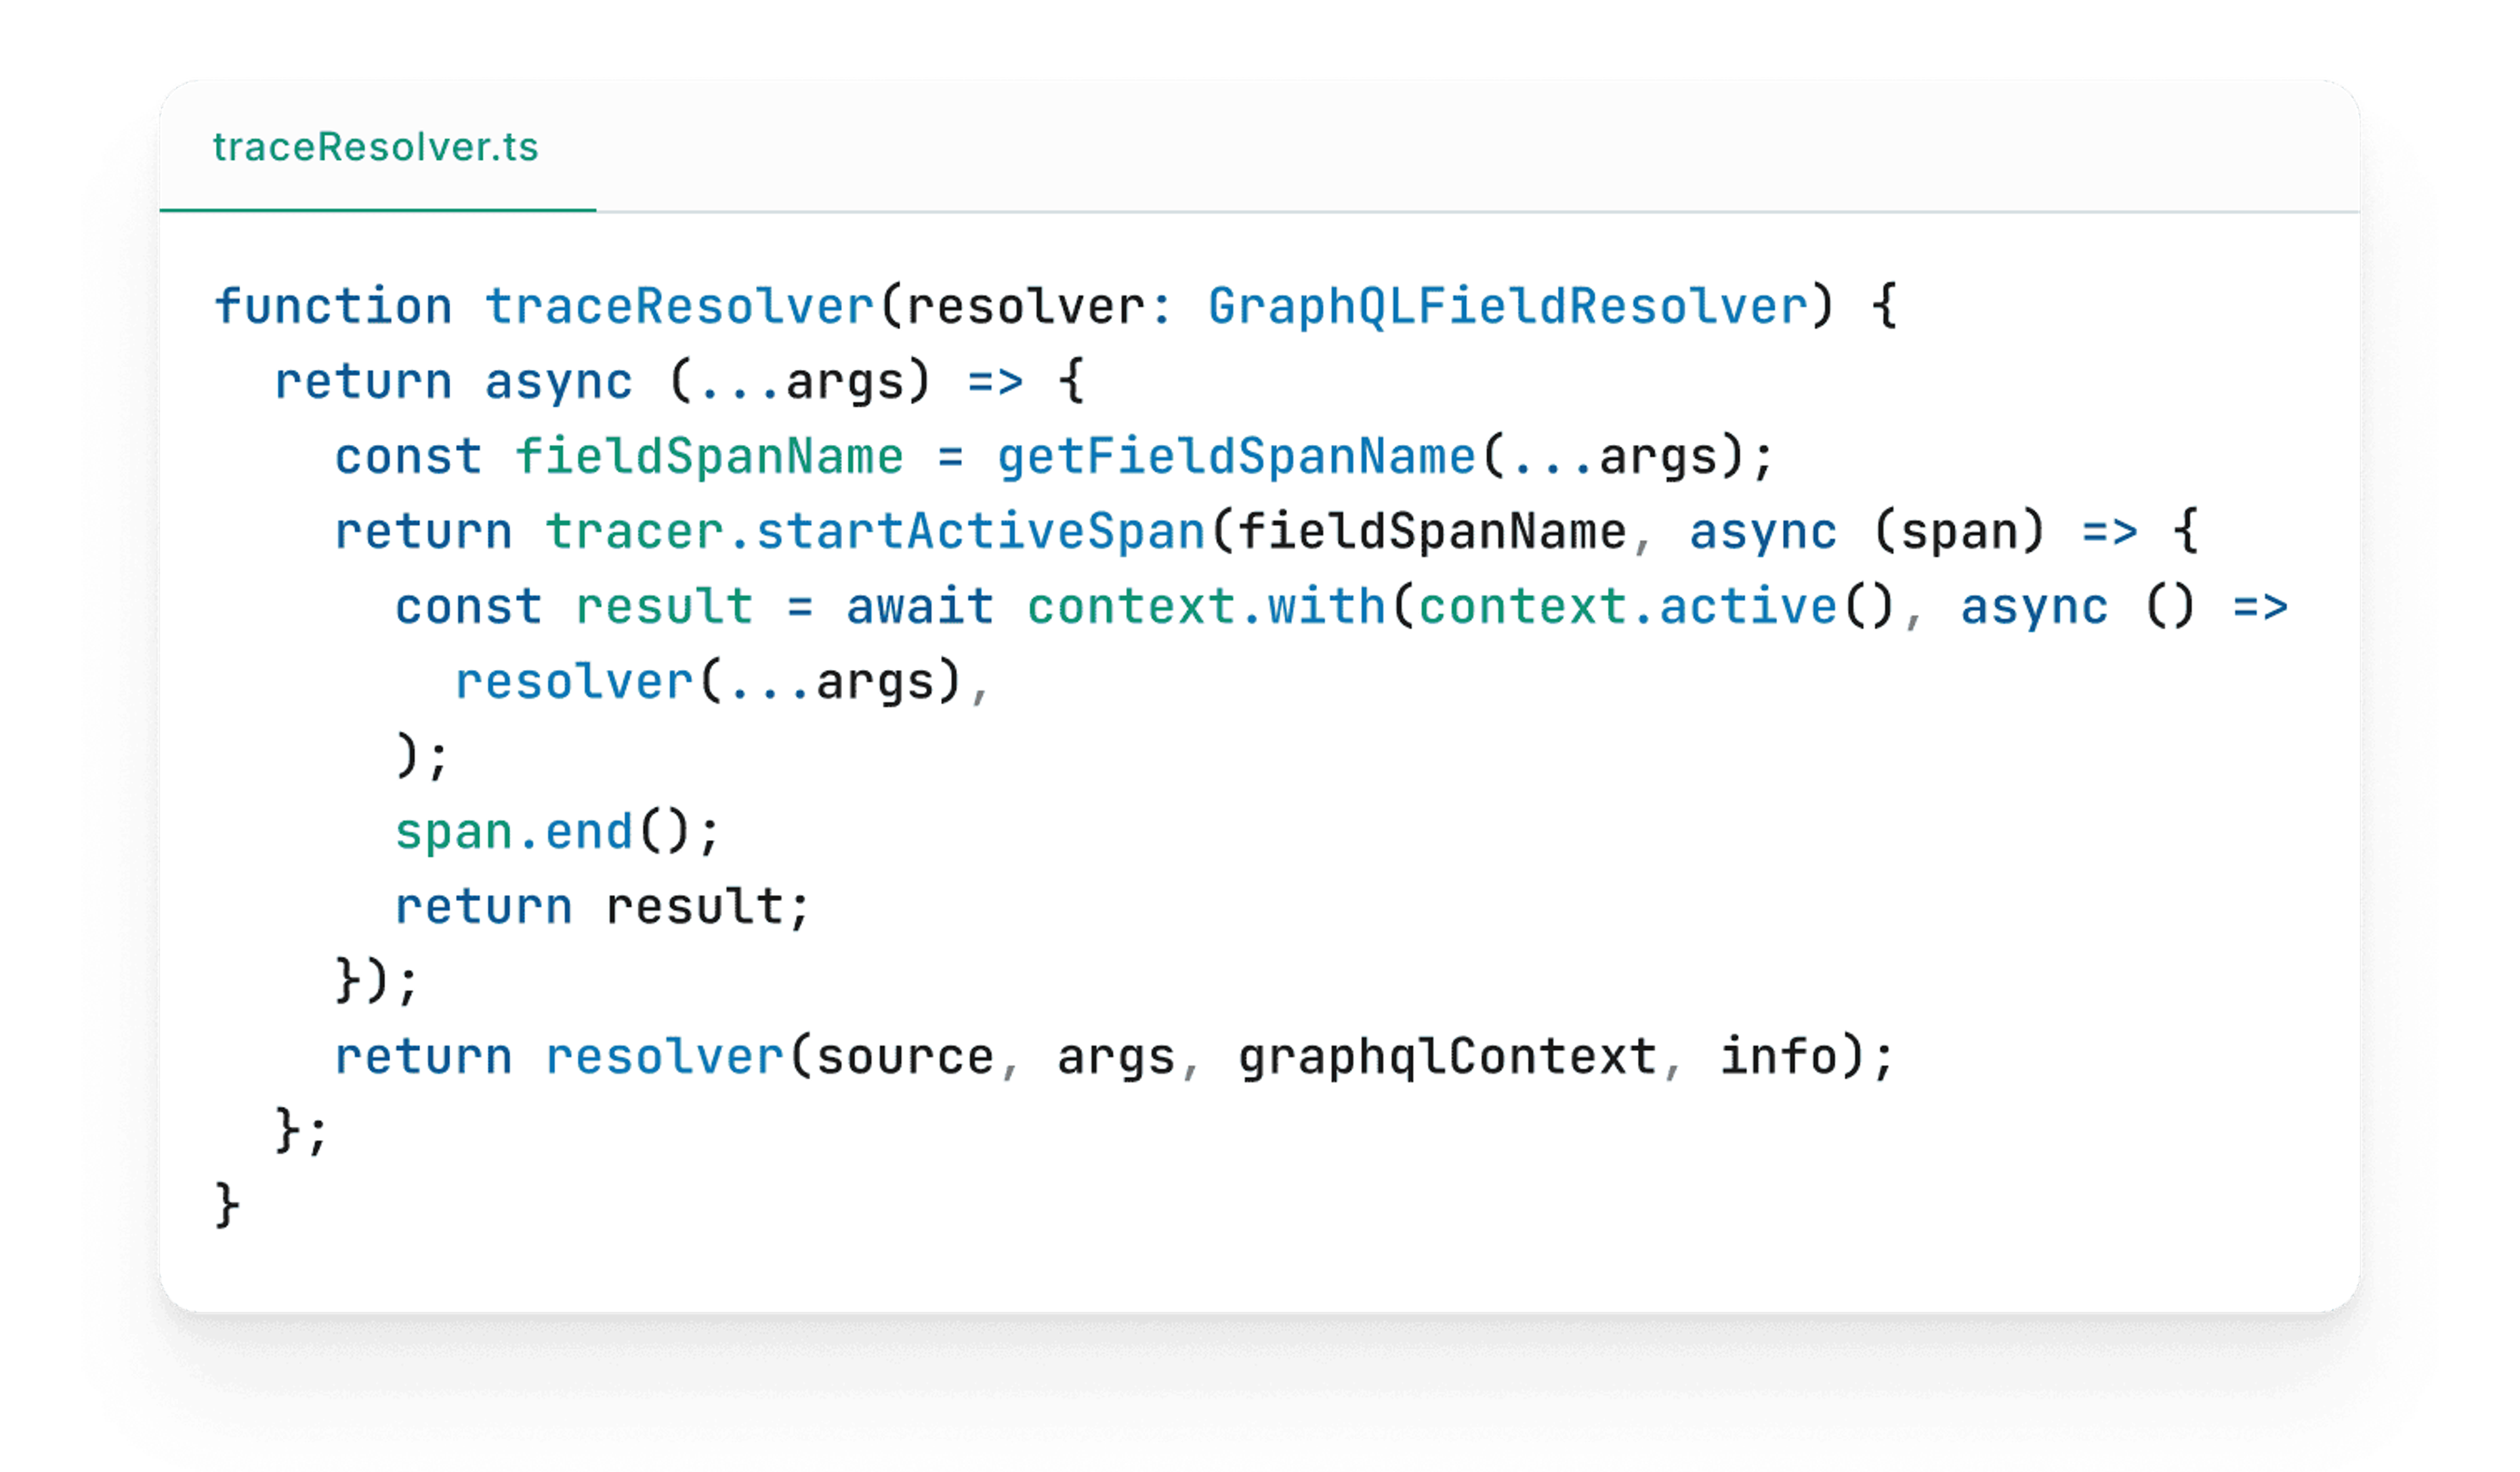
We were ultimately unable to find an open-source implementation of a runtime GraphQL tracing solution, so we wrote a custom Apollo Server plugin to create spans for each Query or Mutation. We use Apollo’s lifecycle hooks to create an active span at the start of each query, and end it when the query finishes resolving.
This instrumented our queries, but didn’t give us much visibility into the cost of each component of our query execution. We paired this plugin with code that wraps every resolver in our schema with a span, to give our traces high-fidelity data about each GraphQL query’s execution.
With our custom Apollo tracing in place, we had a clear understanding of high-level performance, and creating custom spans with the OpenTelemetry SDK allowed us to generate finer-grained spans for internal codepaths. The last piece of the puzzle was tracing our database to understand where we had slow queries or were executing too many database operations.
Challenge #2: Database Tracing
Tracing our database operations presented its own set of challenges. We use both Firestore and PostgreSQL, each requiring different instrumentation approaches. PostgreSQL was easy to instrument, thanks to an existing instrumentation package for postgres.js which worked out of the box.
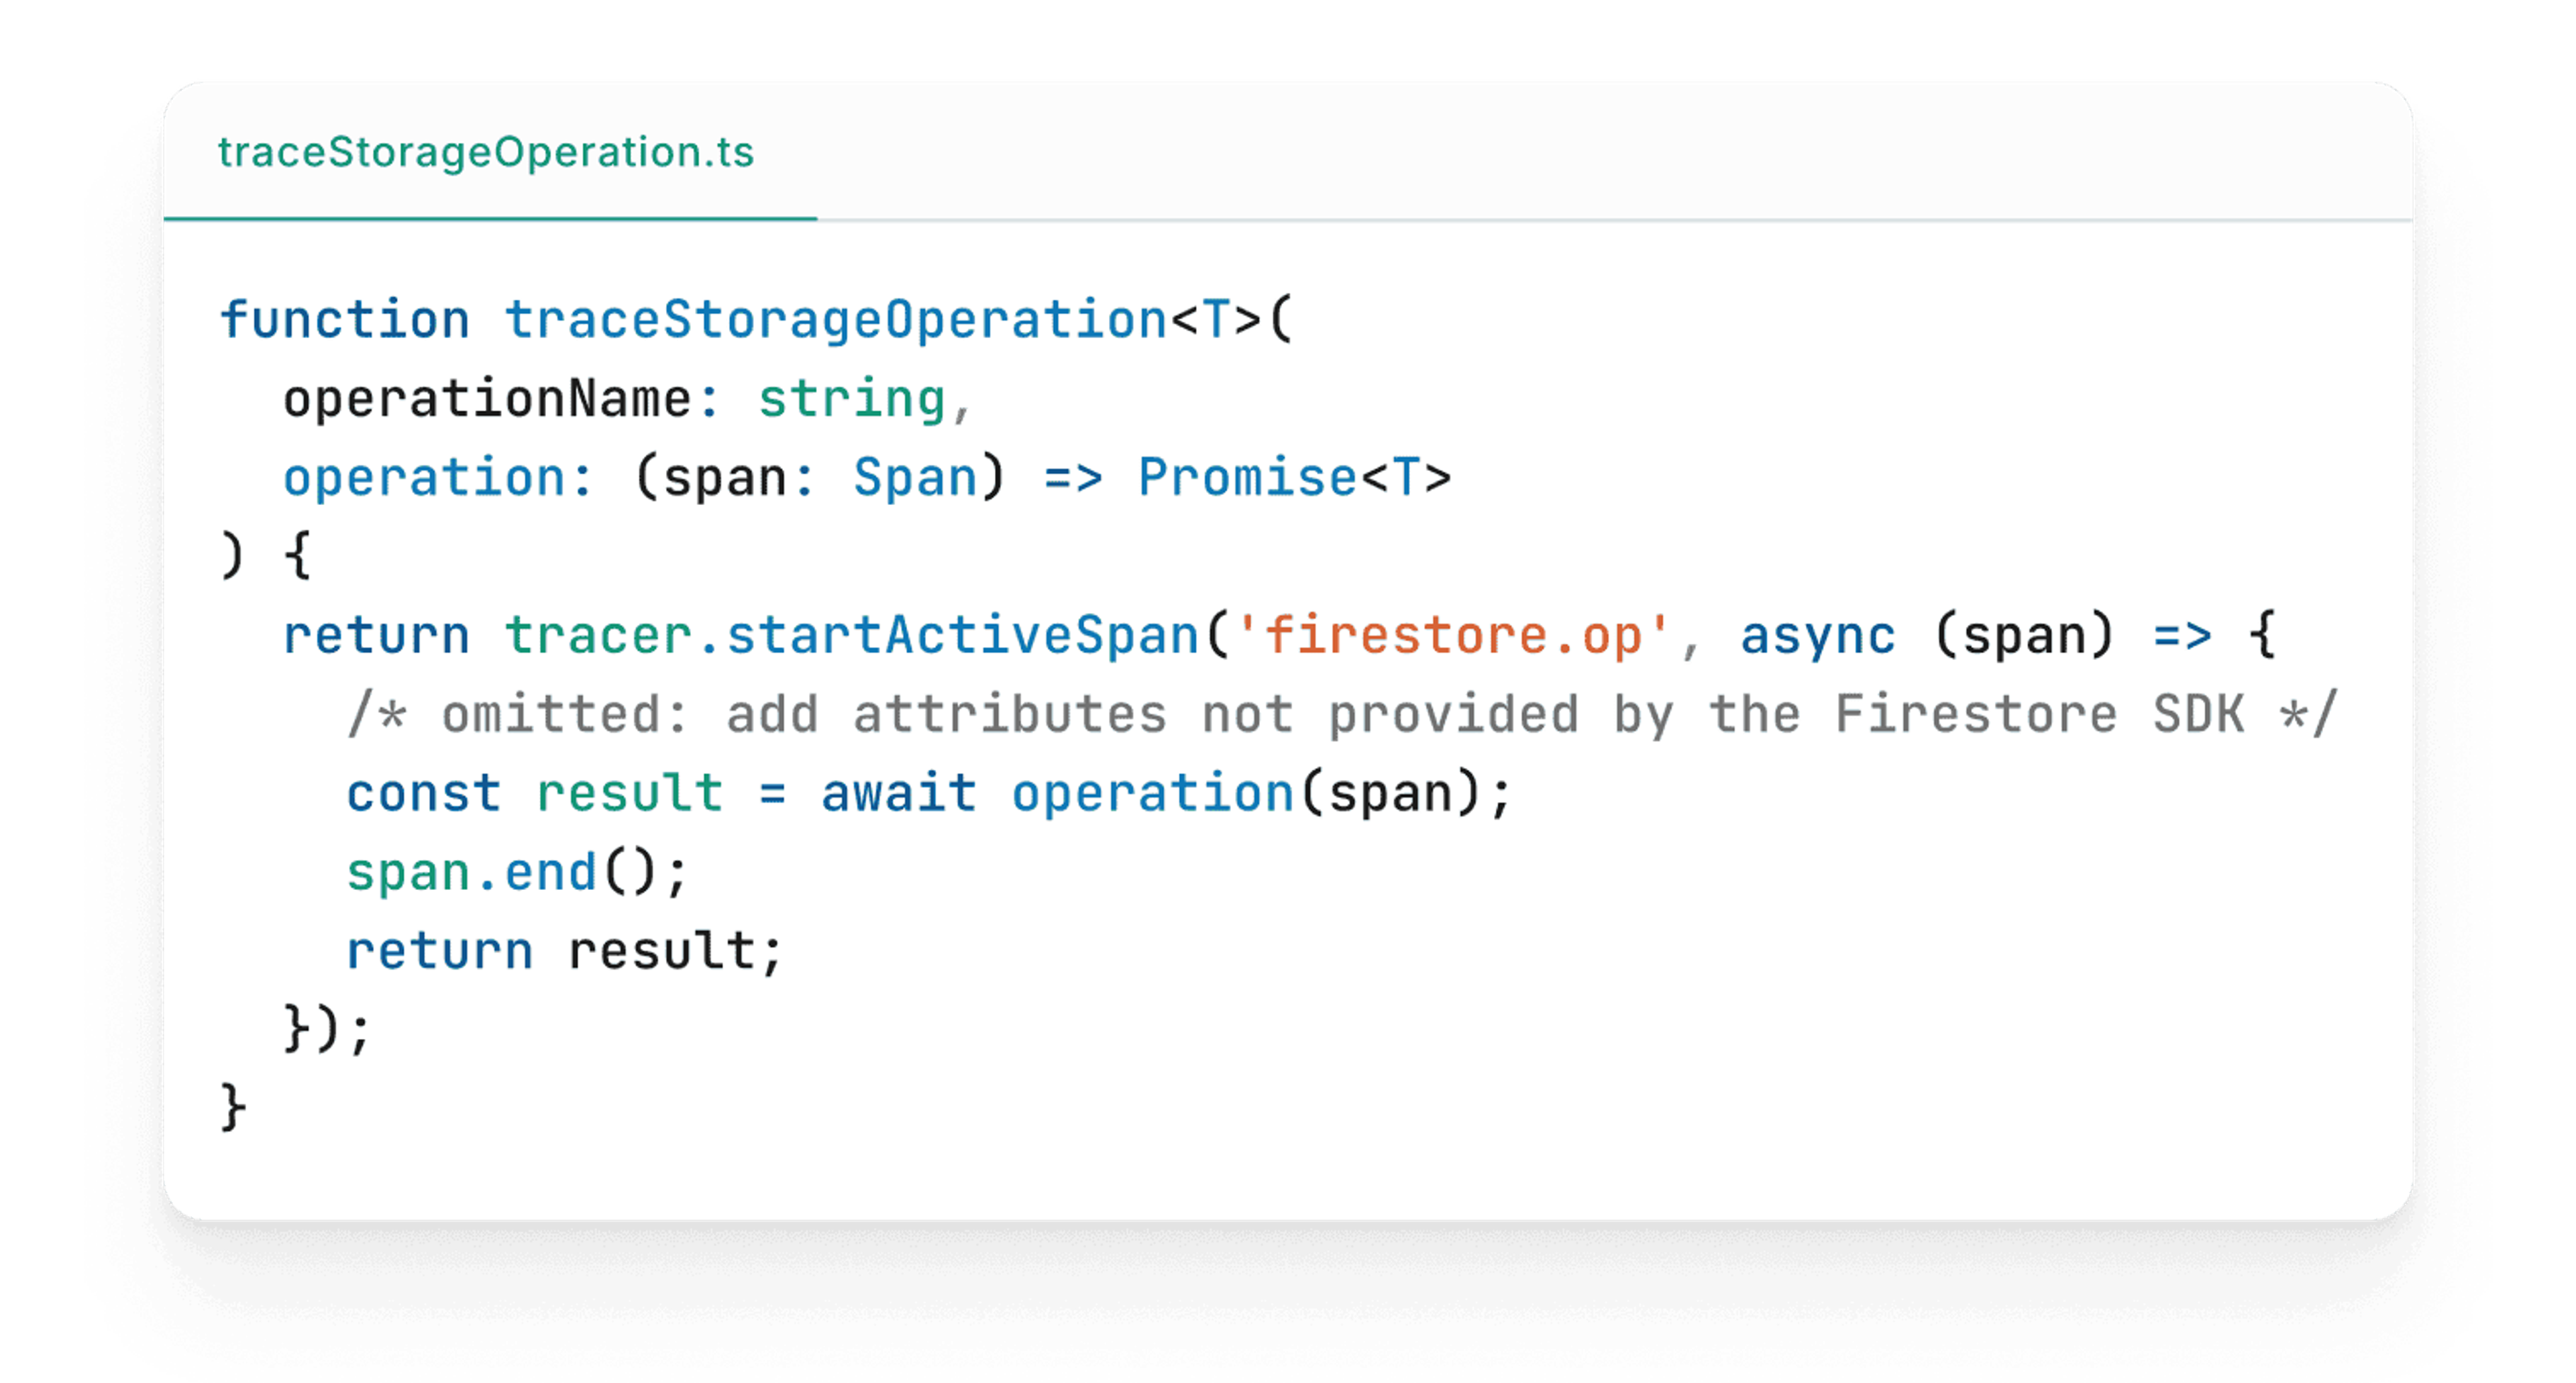
While the official Firestore SDK does include tracing events, they’re incredibly high-volume and unfortunately have limited useful data attached, such as the specific collection being queried. We chose to write our own wrapper around the Firestore client that created spans for each database operation. Fortunately, since each of our database collections passes through a shared ORM-like abstraction, this proved fairly straightforward. We simply wrapped every Firestore operation with tracing code similar to our Apollo resolver code:
Challenge #3: Client Tracing
As a team, we made the decision to not build any infrastructure to link backend traces to client traces. Given our backend is fully isolated from our frontend via our GraphQL API, a full-stack trace for our app is unnecessary, and would likely produce traces so overwhelming they’d be difficult to grok and consume. Instead, we implemented separate client and server tracing to allow us to optimize the runtime user experience separately from our backend performance and reliability.
Tracing client code is deceptively hard, as OpenTelemetry’s browser instrumentation was not designed for modern client-side applications which comprise more than a static HTML file. Because modern applications have minimal markup in their HTML file by default, markup is mostly hydrated in JavaScript, and API requests are executed outside the scope of the initial HTML page load, traditional client tracing misses most of the interesting parts of loading Ambrook.
Instead we built more custom instrumentation. We hijacked the basic OpenTelemetry browser instrumentation and introduced a concept of a “session” on top of it, which starts when the user opens the page and completes when the page’s main content is rendered. This gives us visibility into the full lifecycle of loading JavaScript bundles, rendering, and executing API requests that make up a full client-side page load.
Picking a Storage Provider
Picking a provider to store and serve our tracing data proved tricky. Many providers that would allow us to send a high volume of data had very restrictive limits on the amount and types of data we could send. As a startup with a wide distribution of customer needs, the ability to track granular attributes like account IDs within our tracing data is critical. In addition to traces, we also need this platform to support timeseries metrics for data that isn’t well-suited to tracing. Lastly, we need the ability to run complex queries across spans to build dashboards and track SLOs for our platform.
Honeycomb ultimately emerged as our preferred option. Honeycomb encourages “wide” events, allowing up to 2,000 attributes on each span in a trace, with no limits on unique values. Their pricing structure simply prices by event, meaning we can send as much data as we want for a fixed cost. Most importantly, timeseries metrics in Honeycomb are just “events,” so they fit nicely into the billing, and their advanced query and visualization capabilities allow us to dive deep into traces, performance problems, and error rates. For just $130 per month we are able to send 100 million events with near-zero operational cost, and perform important tasks like alerting on performance changes and defining team-wide SLOs.
The Payoff: Real-Time Insights
Despite the challenges, the payoff has been substantial. We now have unprecedented visibility into our application’s behavior. We can see exactly what happens when a customer interacts with our application, how that interaction flows through our system, and where any bottlenecks or errors occur.
This visibility has already helped us identify and fix several issues that were previously difficult to reproduce or understand. We discovered certain GraphQL queries which were triggering unnecessary database reads, allowing us to save over 10 million unnecessary reads from Firestore each month. We learned about several N+1 query problems in our financial reporting product, reducing the time required to generate financial statements by 85 percent. Lastly, we were able to uncover several smaller data duplication issues in core APIs that reduced our 90th percentile query duration for queries outside of our reporting product from 0.9 seconds to 0.7 seconds.
With new tracing in place and increased visibility into the exact set of operations that make up the most complicated parts of our product, these issues were immediately visible and actionable to the team, allowing us to serve our customers’ needs better than ever before. All of these improvements have compounded to improve overall application performance more than 30 percent, and our newly improved ability to dive deep into errors has helped solve even more issues that would have otherwise gone unnoticed.
If you want to improve the experience of your application, the first step is having the right data to do so. Gathering detailed data about your systems enables a data-driven approach to ensuring your customers see a product you can be proud of.