


A natural experiment allows us to compare the participation rates of the Conservation Reserve Program (CRP) and the Pasture, Rangeland, and Forage (PRF) insurance product. We find that the two offerings are competing with each other.
The United States Department of Agriculture (USDA) has a broad mandate, seeking to achieve concurrent goals through its various agencies and initiatives. Two such goals are represented by the programs at the core of our analysis: (1) conservation and (2) risk management.
These goals are both among the USDA’s highest priorities. Risk management keeps food producers in business through highly variable farming seasons, thus retaining farming expertise and providing security for the nation’s food supply. Conservation protects the nation’s watersheds and allows depleted soils to recover, ensuring that there are fertile farmlands for future generations. The two goals are not inherently at odds, but individual programs can inadvertently compete for the same producer pool’s attention and farmland.
In this new article, we use a cutting-edge econometric analysis to take advantage of the natural experiment created by the rollout of PRF insurance to find evidence that these two USDA programs are indeed cutting into each other’s enrollments. These programs have significant budgets, and it is possible that the competition between them is raising the total cost to the USDA to meet both its risk management and conservation goals.
Conservation Reserve Program (CRP)
The Conservation Reserve Program was created as a result of The Food Security Act of 1985. CRP participants cease agricultural production on portions of their land that have been deemed “environmentally sensitive” in exchange for rental payments from the government. Halting this production is meant to aid in the recovery of soil health, water quality, erosion, and wildlife habitats. CRP expanded from a limited application window now known as the “General sign-up period”, and has added an additional “Continuous enrollment period” for land that is particularly important for certain environmental concerns. This analysis includes acreage from both the General and Continuous CRP sign-up periods.
Pasture, Rangeland, and Forage Index Insurance (PRF)
Pasture, Rangeland, and Forage rainfall index insurance began in 2007 as a pilot program developed by the Federal Crop Insurance Corporation (FCIC). Its goal is to provide insurance for livestock producers who were traditionally underserved by existing federally-subsidized crop insurance.
PRF insures livestock producers against below average rainfall that would reduce hay and pasture yields. This can trigger a cascading series of effects for ranchers: increasing costs by requiring additional feed purchases and/or reducing revenues by forcing earlier-than-anticipated sales.
A livestock producer can enroll any pasture or hay acreage in PRF so long as it is utilized to feed livestock, but—relevant to our analysis—acreage enrolled in CRP is not eligible.
Unlike traditional crop insurance products offered by the FCIC which are structured around producers’ observed yields, PRF is structured around an index—AKA an average—of historical rainfall data. Rainfall in insured acres is compared to this index, and the policy holder receives payment if observed rainfall drops sufficiently below the historical average.
This technique lowers the cost of program implementation and decreases the time it takes producers to receive payment when a loss occurs because insurers do not need to expend resources measuring and verifying a producer’s yield.
The Rollout of PRF Created a “Natural Experiment”
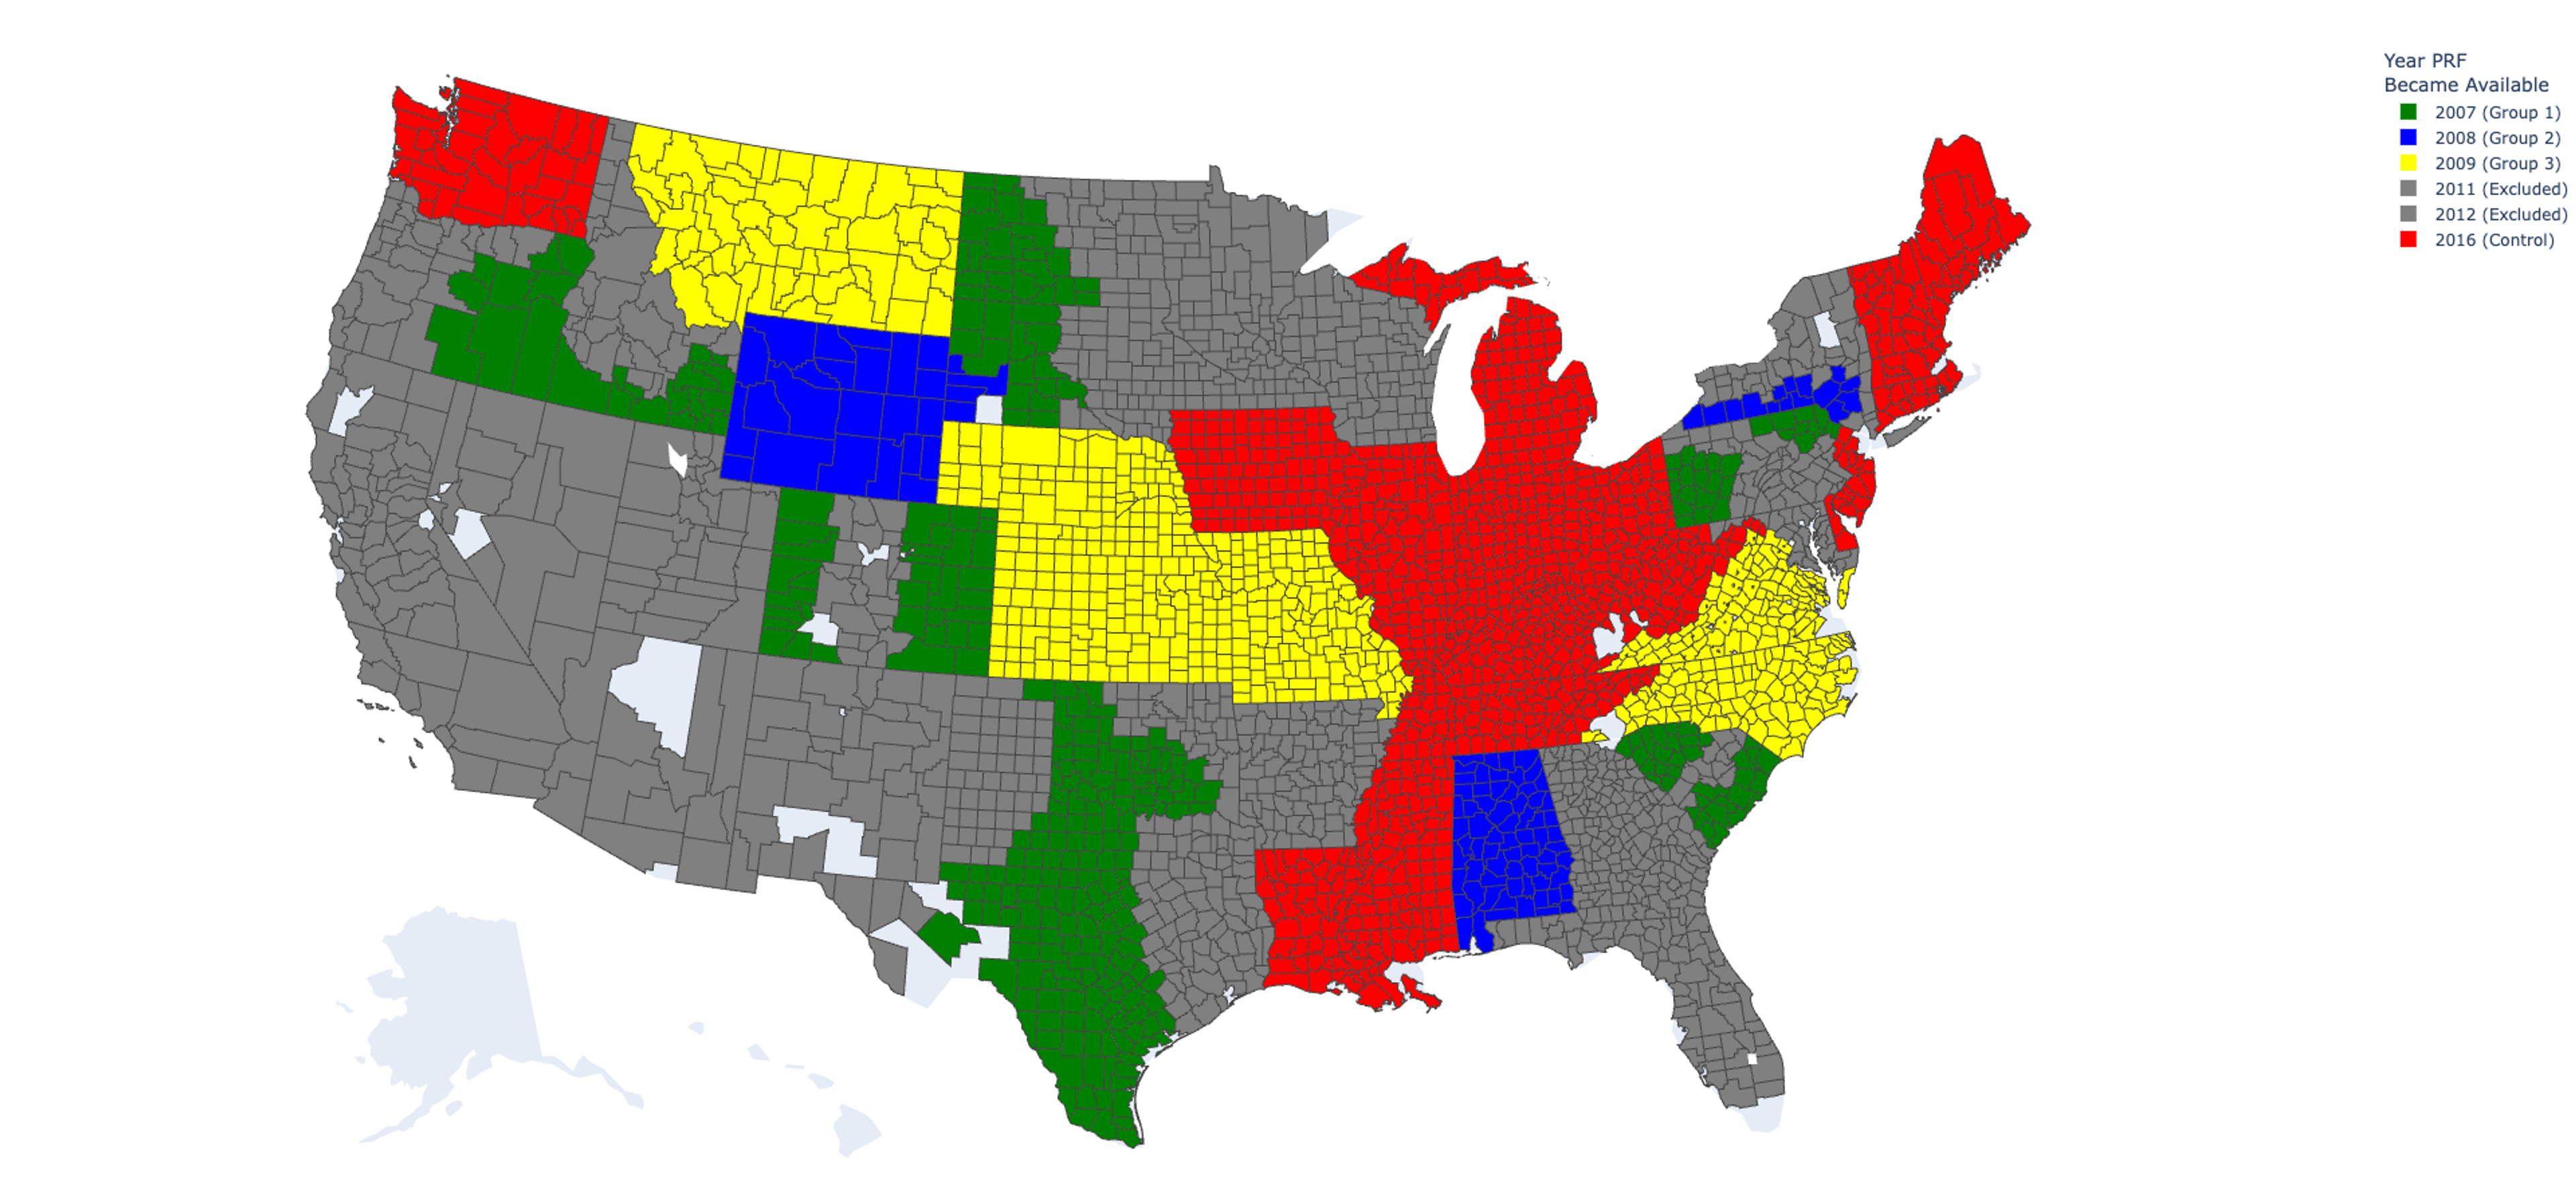
The groups visualized above will be referred to throughout the analysis.
In economics and other social sciences, it is rarely possible to conduct a controlled experiment to directly answer a research question because when large groups of humans are the experimental subjects, most experimental treatments are neither feasible nor ethical. Economists instead seek out so-called “natural experiments”, where an event coincidentally separates the research population into subsets that resemble treatment and control groups.
As visualized in Figure 1, the PRF insurance product was introduced to select counties starting in 2007, and increased its footprint year-by-year until it was available to all counties in the US for the first time in 2016. CRP was available nationwide during this entire time period. These conditions constitute the desired “natural experiment” and create a treatment group (counties with access to both CRP and PRF) and a control group (counties with access only to CRP) for each year between 2007 and 2013. By comparing these groups, we can measure the effect of PRF availability on CRP enrollment.
Data
We compiled panel data of county-by-year observations for CRP enrollment, PRF availability, and the below covariates from 2007 through 2015. Because CRP began to be limited by its acreage cap in 2010, we exclude counties that gained access to PRF between 2010 and 2013 from our treatment groups. Table 1 summarizes the variables of our dataset.
| Dependent Variable | Description | Sample Mean | Sample Standard Deviation |
|---|---|---|---|
| Share of cropland enrolled in CRP | CRP Acres / All Cropland Acres | 5.5% | 8.3% |
| Independent Variable of Interest | |||
|---|---|---|---|
| Availability of PRF in county | True or False | Not Applicable | Not Applicable |
| Additional Control Variables | |||
|---|---|---|---|
| Historical CRP Share (10-year average, as of 2006) | CRP Acres / All Cropland Acres | 5.4% | 8.1% |
| Historical Average Precipitation (April - September 10-year average, as of 2006) | Millimeters | 544 mm | 183 mm |
| Historical Average Temperature (April - September 10-year average, as of 2006) | Degrees Celsius | 20.0 ℃ | 3.5 ℃ |
| Total Cropland Acres | Acres (2002 Census) | 144,726 Acres | 149,232 Acres |
| Share of Cropland that is Pastureland | Pasture Acres / Cropland Acres (2002 Census) | 21.6% | 19.8% |
Our main hypothesis is that introduction of the PRF program reduced the share of CRP acreage. Thus, the outcome of interest is the county-level annual share of CRP acreage, which is measured by active CRP acreage divided by each county’s total cropland acreage. We leverage the “natural experiment” of PRF’s rollout to test for causality. Therefore, the first year of PRF availability in a county is our key experimental variable.
The additional control variables are meant to capture potential systematic differences between the groups of counties that were given access to PRF in different years. For example, PRF was available to most Texas counties in 2007, but PRF was not open to New York counties until 2008. We suspect these two states likely enroll in CRP at different rates for reasons other than PRF availability, and thus use the broad pasture-agriculture-related variables above to define and adjust for those differences.
Methods
With a “natural experiment”, one can use a “Difference-in-Differences” approach to estimate the effect of a treatment, like the introduction of PRF insurance. The “Difference-in-Differences” family of models are so named because they seek to show causality by:
Eliminating factors that are constant over time within the treatment group by subtracting the treatment group’s end state from its beginning state (Difference #1).
Eliminating factors that are constant over time within the control group by subtracting the control group’s end state from its beginning state (Difference #2).
Subtracting the control group difference (Difference #2) from the treatment group difference (Difference #1) to eliminate all time factors and be left with only the impact of the experimental variable. (Hence, the final estimate is a difference between two differences.)
In the current analysis, we are interested in the difference in CRP enrollment over time as impacted by the difference in availability of PRF insurance over time. Estimating a “Difference-in-Differences” model with the two-way fixed effects estimation is most statistically sound when the data has only two time periods—before and after an event of interest—or the effect of the intervention is assumed to be equal across units. In this analysis, however, we have multiple time periods among which our experimental groups change sizes—PRF was made available to more counties every year until it was available nationwide—and it is reasonable to expect the differences in the treatment effect across counties. In such a formulation, the standard two-way fixed effects estimation has the potential to be biased.
A new econometric technique described by Callaway and Sant’Anna (2020) has been introduced as an alternative. This technique solves the multi-period problem—In our specific case caused by the staggered rollout of PRF—by estimating unique treatment effects, or ATT, for each group-time pairing. Thus, in our main analysis, the Callaway and Sant’Anna method estimates a total of 27 average treatment effects: 3 groups of counties with effects measured across 9 years of observations, including placebo effects during the pre-event periods. It’s difficult to draw conclusions about broad trends with such specific estimates, but Callaway and Sant’Anna provide aggregation techniques so that one can aggregate the group effects for broader interpretation. In the current analysis, we focus on a simple weighted average of the effects among all treated groups during the post-event periods and a dynamic aggregation where we aggregate the effects by length of treatment exposure—the years since PRF was introduced.
As discussed in the earlier section, one may worry about the fundamental difference between the 3 groups and the control group. Thus, we conduct an adjustment and reweight the observations using the additional control variables in Table 1. The procedure of the doubly robust estimation follows that of Callaway and Sant’Anna (2020).
Results
We found that (1) a county’s access to Pasture, Rangeland, and Forage index insurance causes less acreage to be enrolled in the Conservation Reserve Program and (2) the effect becomes stronger the longer both products are available. Our main model gives the following estimates for the group-time effects of PRF availability on each group of counties:
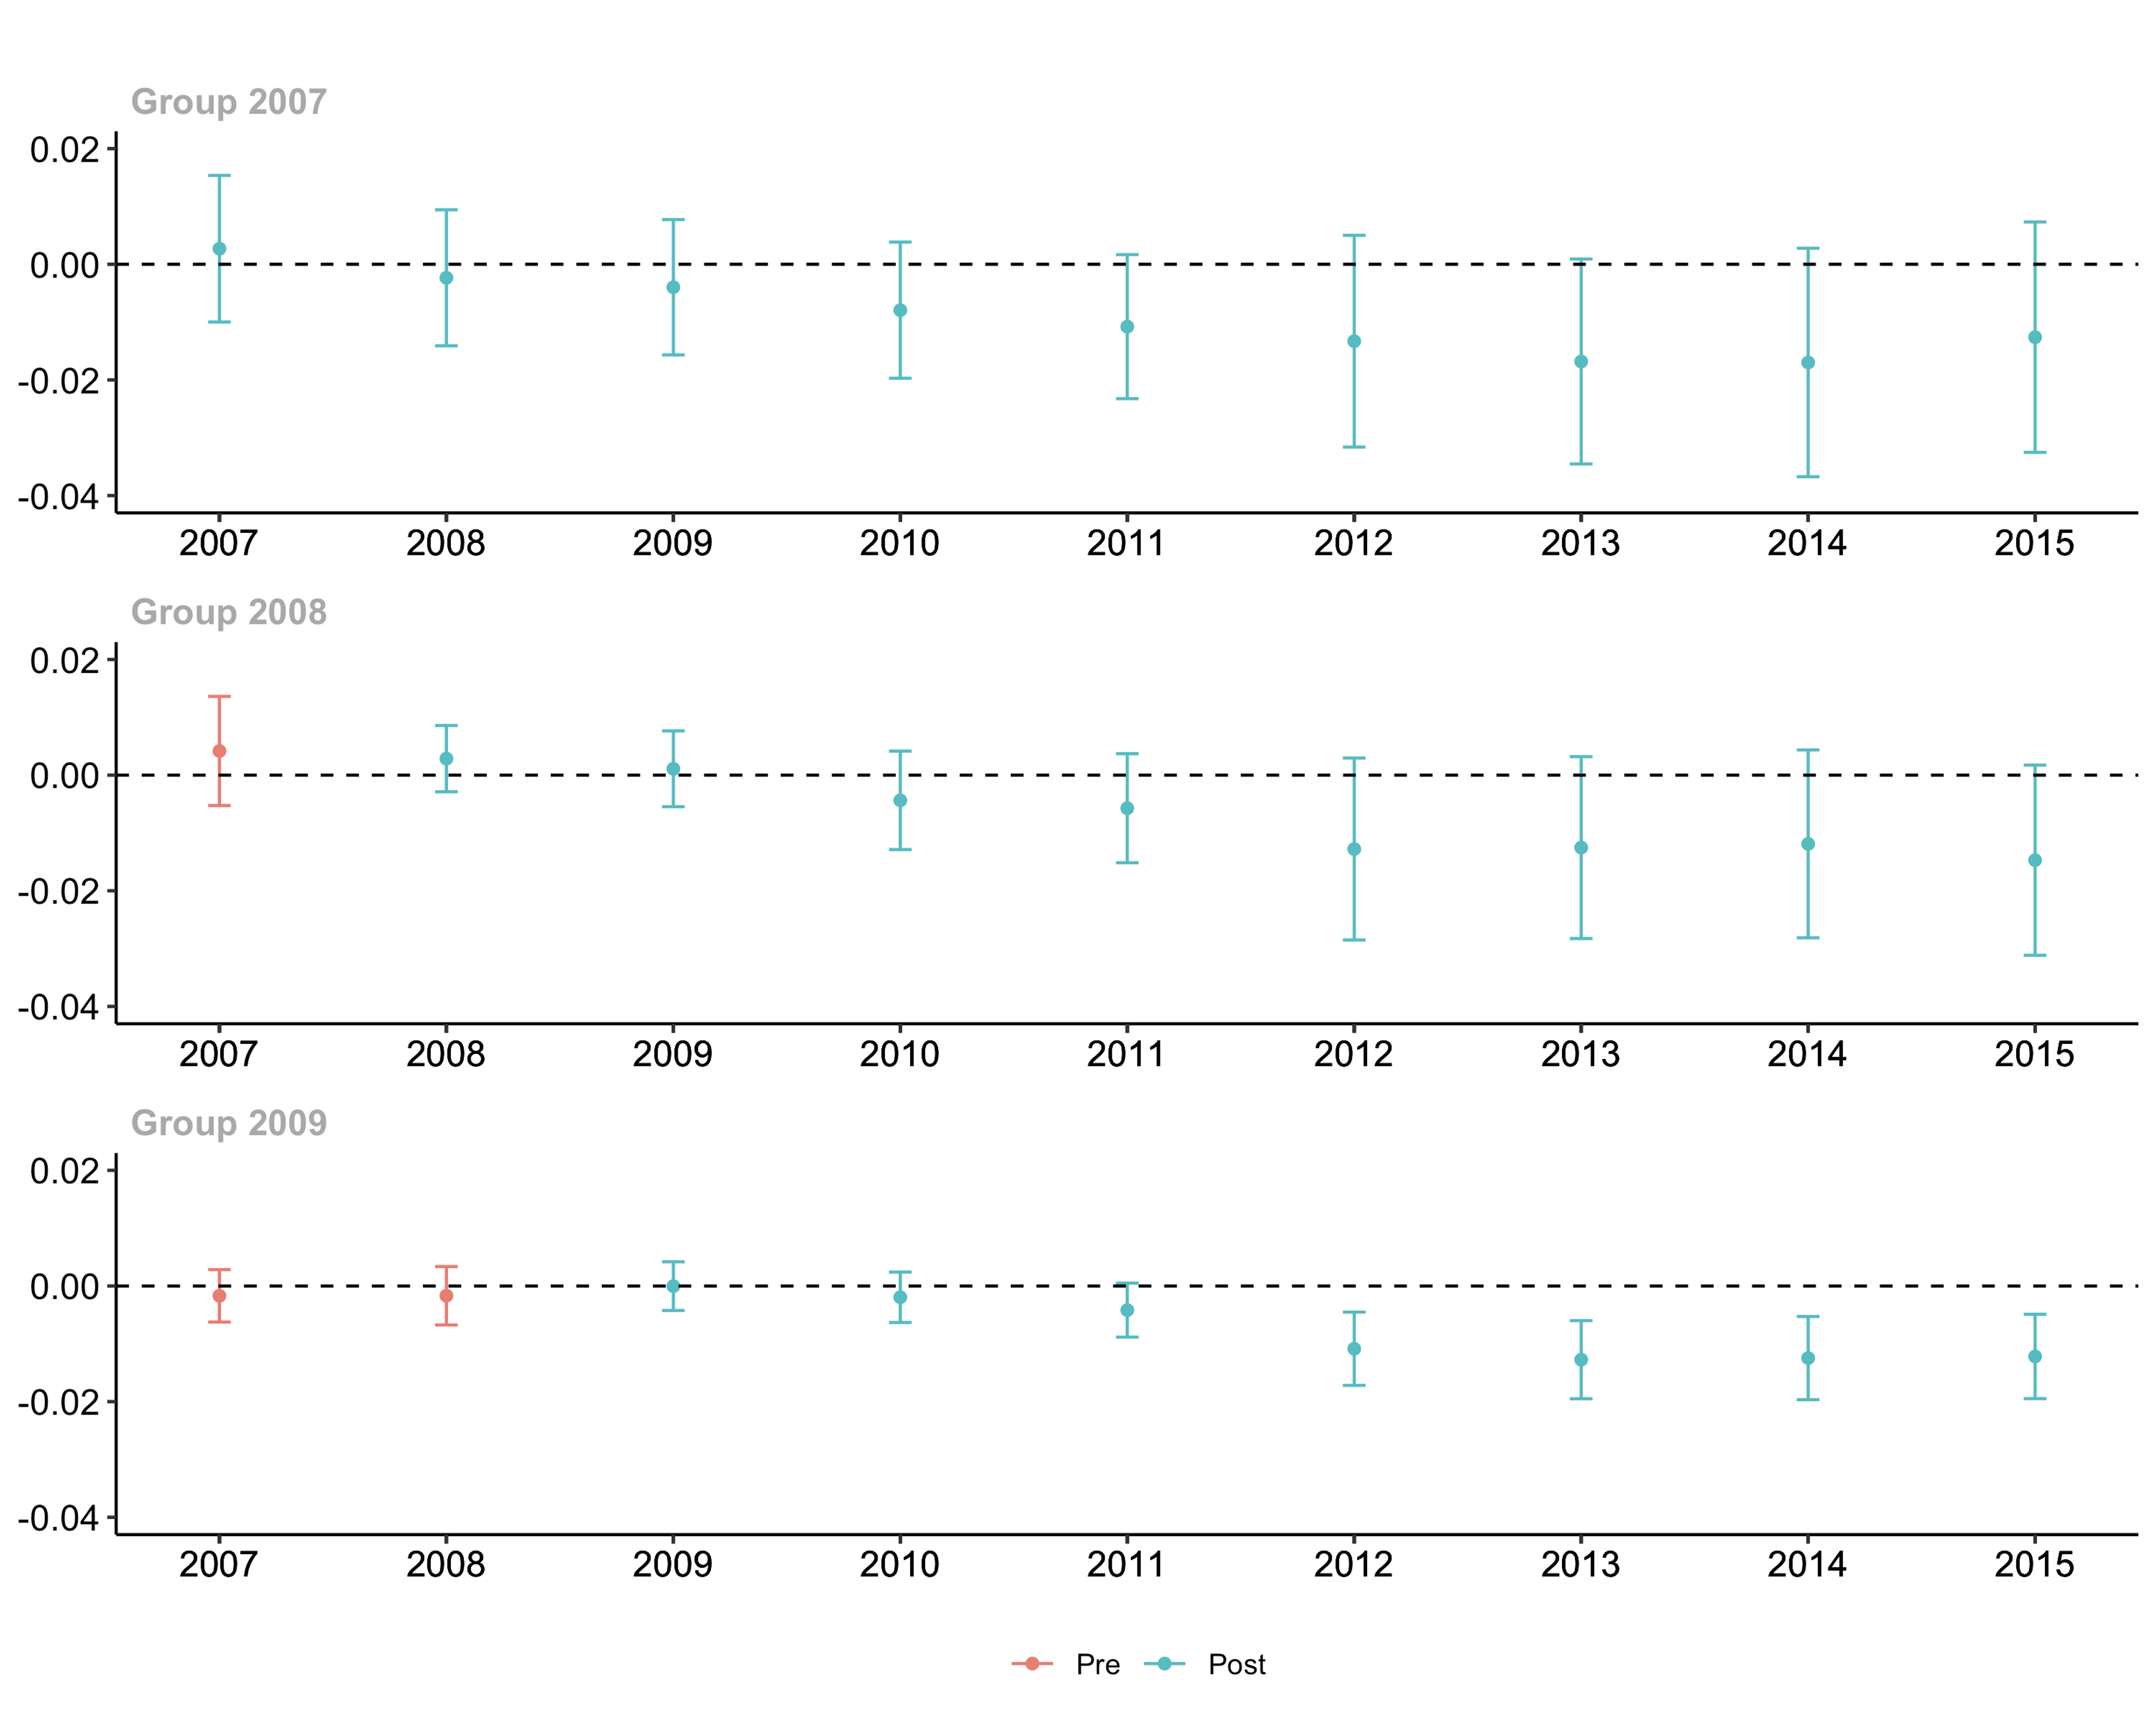
CRP enrollment is reduced when PRF insurance becomes available
While the direction of the individual group-time estimates suggest that PRF insurance substitutes for CRP, the estimates in Figure 3 are small and only statistically significant for the final group. As discussed above, these estimates can also be interpreted broadly when the groups and times are aggregated. When we aggregate across both, we arrive at an estimated effect of -0.0065 which is significant at the 95% confidence level. These estimates are in the units of the dependent variable—CRP share of all cropland in the county—and therefore that total effect can be interpreted as follows: The availability of PRF insurance reduced the CRP enrollment share by 0.65%. With the average CRP enrollment share at only 5.5%, this 0.65% represents a 12% decrease in average CRP enrollment.
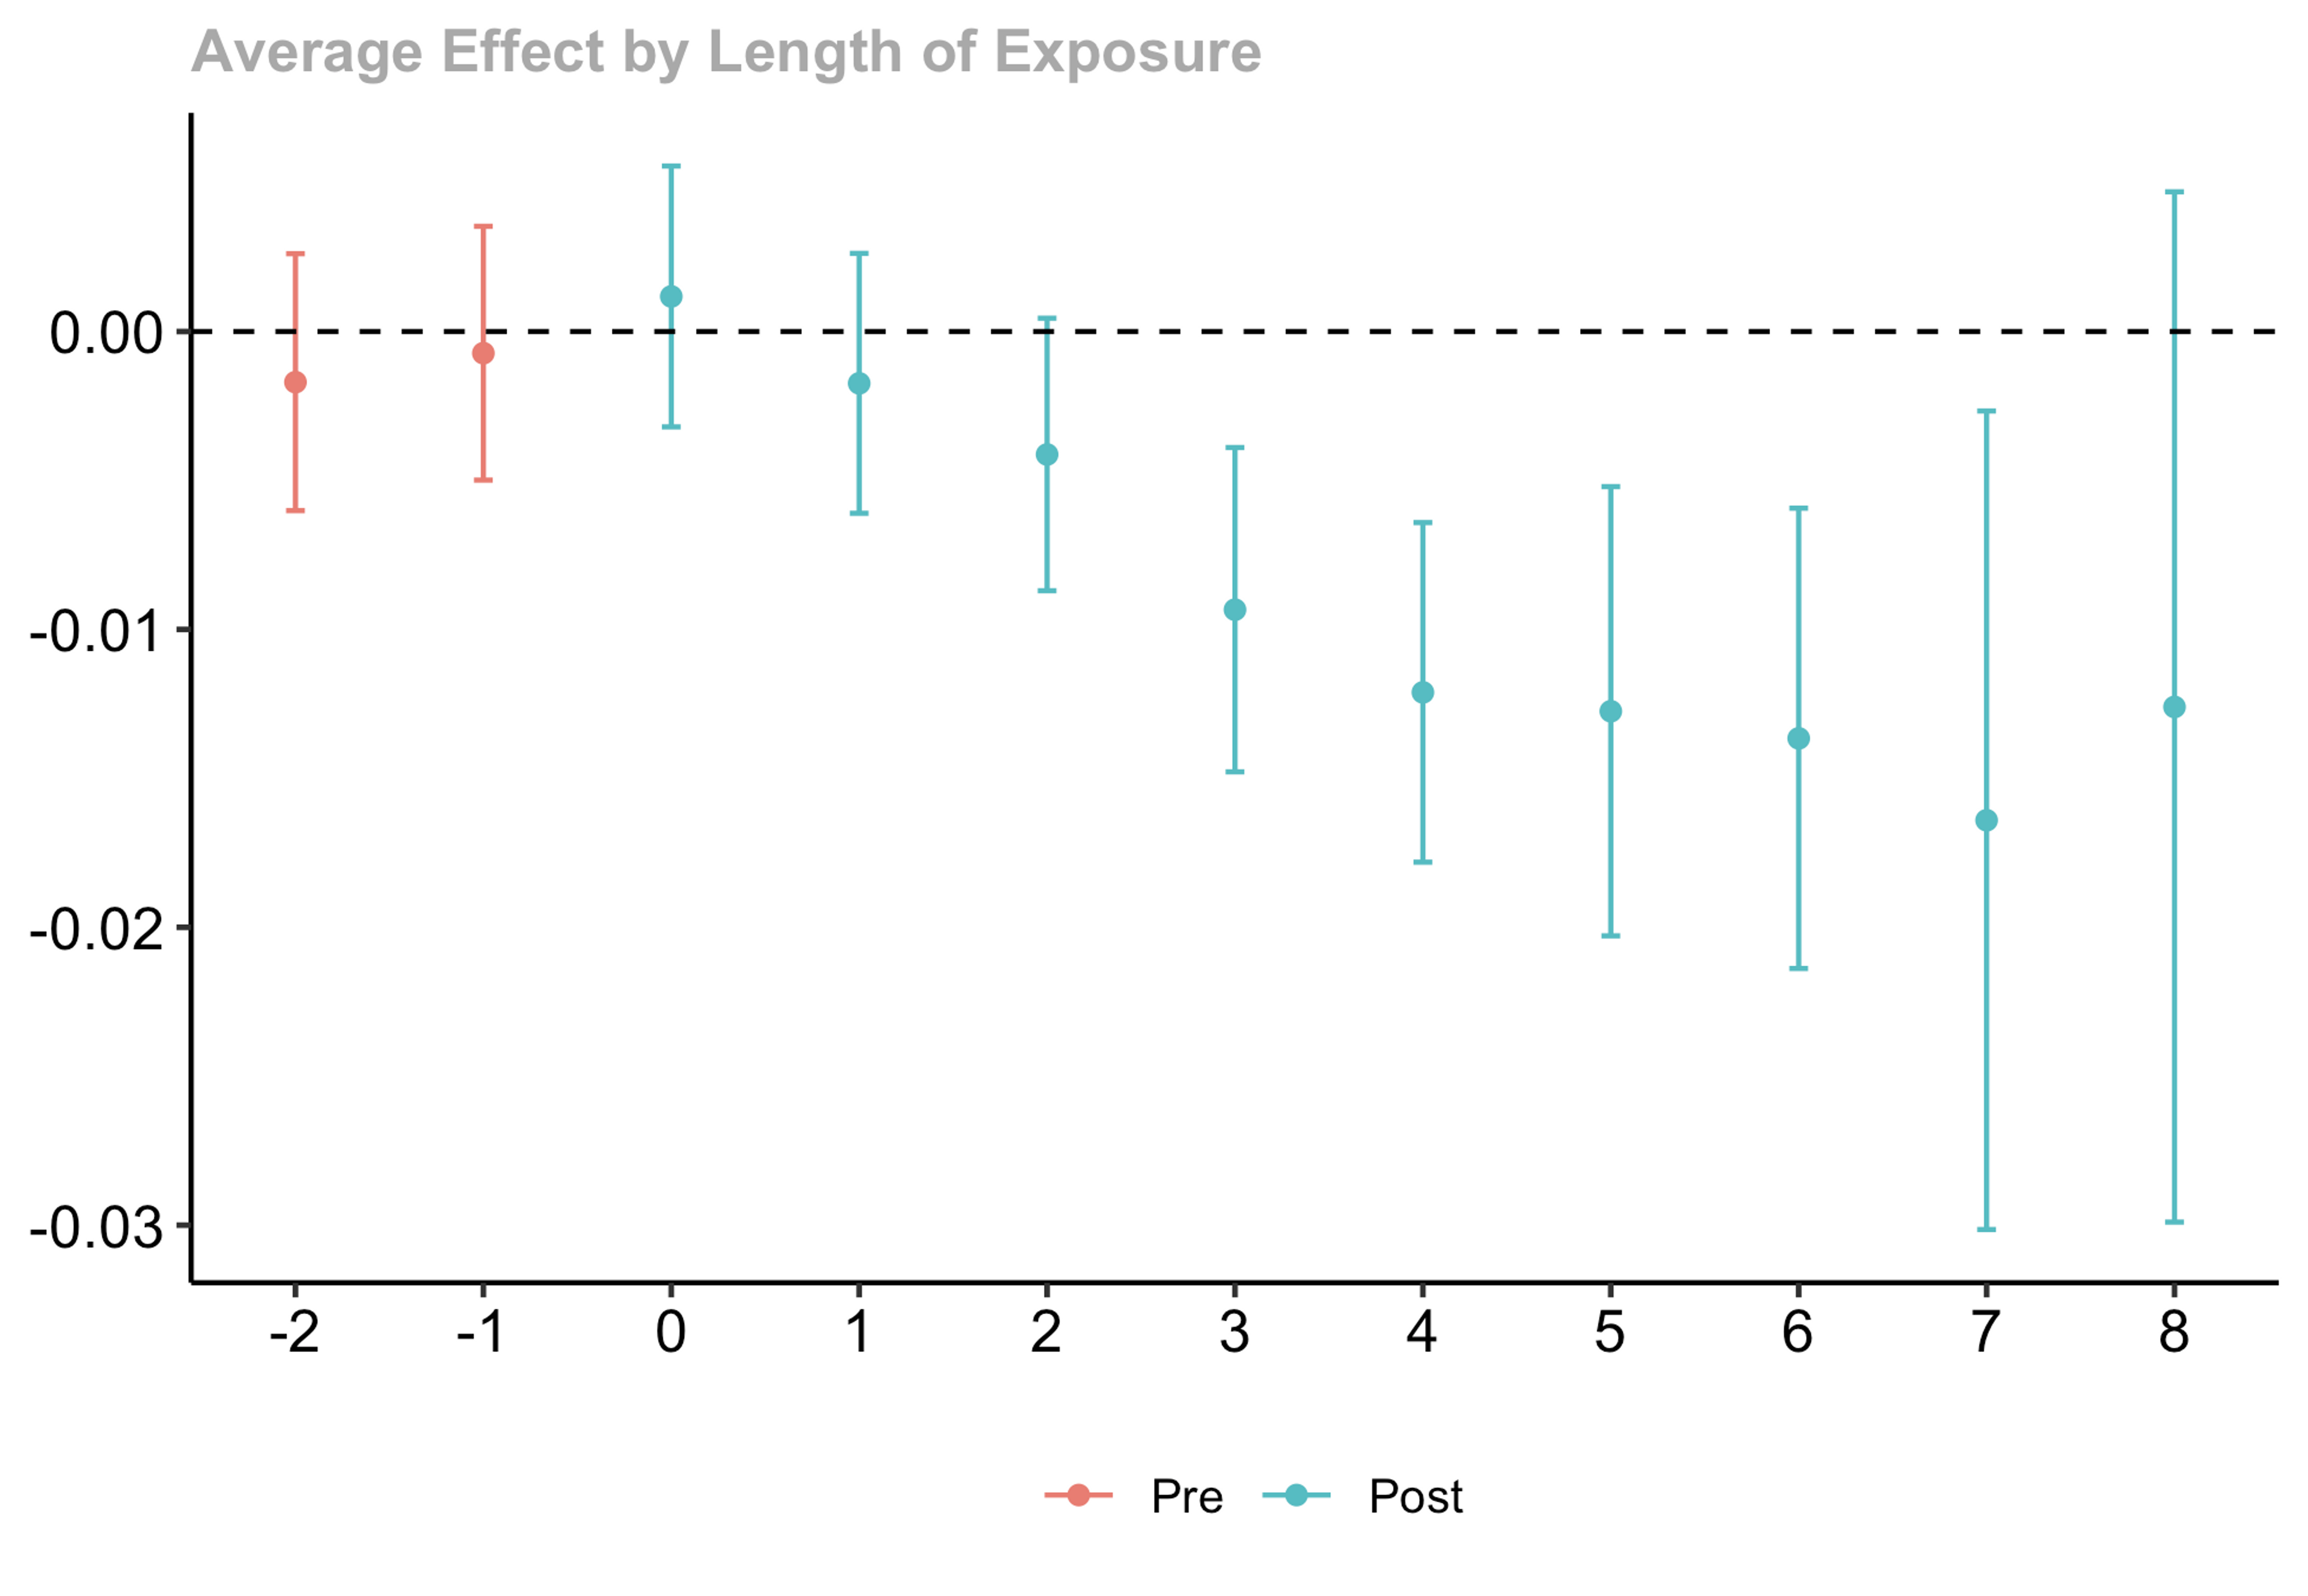
The longer that PRF insurance is available, the more CRP enrollment is reduced
Another way to aggregate the estimates above is by time, specifically by the amount of time that has passed since PRF was made available in a group of counties. Figure 4 plots those aggregated estimates. This aggregation shows a statistically significant impact that grows over time: the availability of PRF reduces CRP enrollment by 1% after 3 years, and almost 2% after 7 years.
Implications
In this analysis we have found that (1) a county’s access to Pasture, Rangeland, and Forage index insurance causes less acreage to be enrolled in the Conservation Reserve Program and (2) the effect becomes stronger the longer both products are available.
Economic incentives of the two programs are conflicting: PRF is a subsidized insurance program that requires producers to keep using their pasturelands for haying or grazing in order to benefit, whereas CRP is a conservation program that incentivizes producers not to utilize their lands. As CRP participation is for terms of at least 10 years, but PRF participation is annual, we observe a pattern of lower CRP enrollment that increases over time as more CRP contracts end.
An implication of our findings is that unrelated policies can interact with each other’s objectives in unintended ways. Policymakers and the administrators of these programs may decide these interactions are positive, negative, or neutral, but their existence should be intentionally considered so as to most efficiently allocate taxpayer resources.