We explore how farm aid funding is distributed and how different application channels can affect accessibility.
With a $146 billion annual budget, the USDA is one of the biggest agencies in the US federal government. Programs under the USDA umbrella include direct cash assistance programs, loan programs, cost-sharing programs that incentivize conservation agricultural practices, and even social welfare programs like SNAP. Access to USDA programs can make or break livelihoods, especially those directly related to agriculture.
In this post, we explore (1) how farm aid funding is distributed and (2) how different application channels are affecting accessibility. To measure how new access channels are changing the beneficiaries of USDA programs, we have to first measure a baseline. Who are the farmers who already have a relationship with the USDA? The USDA answers this question every five years with the Ag Census — a mail-based survey of US farmers administered by the National Agricultural Statistics Service (NASS). The most recent Ag Census was conducted in 2017 and the respondents are summarized in Table 1 below.
| Category | Percentage of US Producers | |
|---|---|---|
| Sex of Principal Producer | Male | 71% |
| Female | 29% | |
| Income from Farm Sales | Less than $100k | 82% |
| $100k to $500k | 11% | |
| Greater than $500k | 7% | |
| Race | No Person of Color | 93% |
| Any Person of Color | 7% | |
| Operation Type (At Least One) | Field Crops | 48% |
| Specialty Crops | 12% | |
| Livestock | 61% |
The Ag Census results show a dearth of farmers from historically disadvantaged populations. This snapshot of farmer demographics in 2017, however, does not show the difficult history that these groups have had with farmland ownership. For example, while farmers of color accounted for only 7% of operators in 2017, the peak of their participation was in 1910, when farmers of color (mostly black farmers) operated about 15% of US farms. It is with that history in mind that the USDA has faced criticism for the low participation rate of these populations in USDA farm-aid programs.
The USDA is taking action to engage historically underserved populations
Starting in the 1990s, the USDA has created programs and benefits specifically for these underserved populations, who are collectively known to the agency as Socially Disadvantaged Farmers and Ranchers (SDFRs). The FSA also created an outreach program with goals to improve communication and trust between the FSA and SDFR communities. Under the Biden administration, Secretary Vilsack’s USDA has taken some additional steps, including:
a $2M grant for non-profits and community organizations who could help SDFRs apply for USDA programs;
resources and process reforms to help people who inherited land without clear documentation resolve estate issues and get clean title on their land; and
a Federal Notice Requesting Public Input, penned in response to President Biden’s Executive Order on Racial Equity, that solicited comments on how the USDA can “make all USDA programs, benefits, and services equitable, and to address the cumulative effects of systemic racism.”
Notably, even measuring the extent of the situation has been difficult. A 2019 GAO study of the Farm Credit System found that it could not draw conclusions about the success or failure of the USDA’s outreach programs because lenders are generally prohibited from asking their clients for demographic information. Even where the USDA can ask for demographic information, producers are often hesitant to give it.
The COVID-19 pandemic necessitated increased digital access to the USDA and its programs
The ongoing COVID-19 pandemic has had an immense impact on agriculture. Among price shocks and meat-processing shortages, however, a relatively unassuming change was born of the pandemic; the USDA started advertising fully digital applications for some of its federal aid programs.
Digitalization has a mixed record of reducing bias, but it has a strong record of increasing accessibility, especially in rural areas. Could this relatively innocuous change increase engagement from farmers more used to doing business on their smartphone than in person at the local USDA service center? And could that accessibility make it easier to serve the Socially Disadvantaged Farmers and Ranchers that the USDA is struggling to reach?
We can look at Ambrook’s users as an initial point of comparison. Ambrook’s Funding Library launched in January of 2021 and invites users to describe their operation to learn about relevant funding opportunities. It asks for some of the same information that is asked for on the NASS Ag Census, but all its users are digital-only, and over 70% of users access the website exclusively through a mobile device.
| Category | USDA % | Ambrook % | |
|---|---|---|---|
| Sex of Principal Producer | Male | 71% | 62% |
| Female | 29% | 38% | |
| Income from Farm Sales | Less than $100k | 82% | 87% |
| $100k to $500k | 11% | 10% | |
| Greater than $500k | 7% | 3% | |
| Race | No Person of Color | 93% | 90% |
| Any Person of Color | 7% | 10% | |
| Operation Type (At Least One) | Field Crops | 48% | 32% |
| Specialty Crops | 12% | 31% | |
| Livestock | 61% | 83% |
While the comparison is not perfect, it does provide some evidence that easy digital access can increase engagement with historically underserved populations. Aside from race and gender, the Ambrook Funding Library has a significantly bigger audience among specialty crop and livestock producers relative to the U.S. farming population at large. A possible explanation is that these crop producers may not have the time or staff needed to interface with the USDA in person but do have the time to check in on their smartphones between other tasks. The USDA’s 2021 survey on Farm Computer Usage and Ownership corroborates that more farmers use smartphones than desktop computers to access the internet.
The recent USDA Notice Requesting Public Input on systemic racism provides some anecdotal support for this conclusion. Code For America submitted a detailed comment citing statistics that Black, Hispanic, and low-income households are more likely to use a mobile phone as their only internet-enabed device and therefore “Mobile accessibility is essential in creating equitable and accessible benefits experiences for non-white audiences.”
These data points are relevant, but do not directly measure the accessibility of farm assistance programs. To address that question more directly, we’ll examine data on the distribution of the Coronavirus Food Assistance Program and especially its positioning as one of the first fully-digital USDA aid applications.
Distribution of the Coronavirus Food Assistance Program (Rounds 1 and 2)
The distribution of CFAP gives an opportunity for a more direct comparison between the subset of users who applied to CFAP entirely online via Ambrook and those that applied to the USDA through their various direct channels. For additional context, Ambrook marketed its service mostly on Facebook, and did not specifically target any race or gender with its marketing. The ‘Race’, ‘Sex’, and ‘Ethnicity’ data below, on both the Ambrook and USDA side, are calculated only where that demographic information was provided by the applicant. This distinction is important because about 88% of Ambrook applicants did not provide demographic information when asked, in comparison to only about 5% of USDA applicants. Therefore, where the USDA data can be fairly applied to the rest of the population who do not give demographic information, the Ambrook sample really only has explanatory value for the population who do give that information.
| Category | % of Ambrook Applicants | % of General USDA Applicants | |
|---|---|---|---|
| Sex | Male | 49.0% | 84.0% |
| Female | 51.0% | 16.0% | |
| Race | Black | 12.1% | 1.0% |
| Indigenous (Native American, Alaskan, or Pacific Islander) | 8.6% | 1.9% | |
| Asian | 0.0% | 0.3% | |
| White | 67.2% | 96.4% | |
| Two or More | 12.1% | 0.4% | |
| Ethnicity | Hispanic or Latino | 18.4% | 1.5% |
| Not Hispanic or Latino | 81.6% | 98.5% | |
| Products Raised | Field Crops | 12.4% | 46.6% |
| Specialty Crops | 22.1% | 5.0% | |
| Livestock | 77.5% | 48.4% |
These numbers show a staggering difference in the participation of SDFRs in CFAP via Ambrook’s portal compared to normal USDA channels. If the biggest difference between these two datasets is that Ambrook applications are a digital-only subset of all USDA applications, then a possible explanation of the increased SDFR participation is that the benefits of a 100% digital application increased accessibility for those applicants.
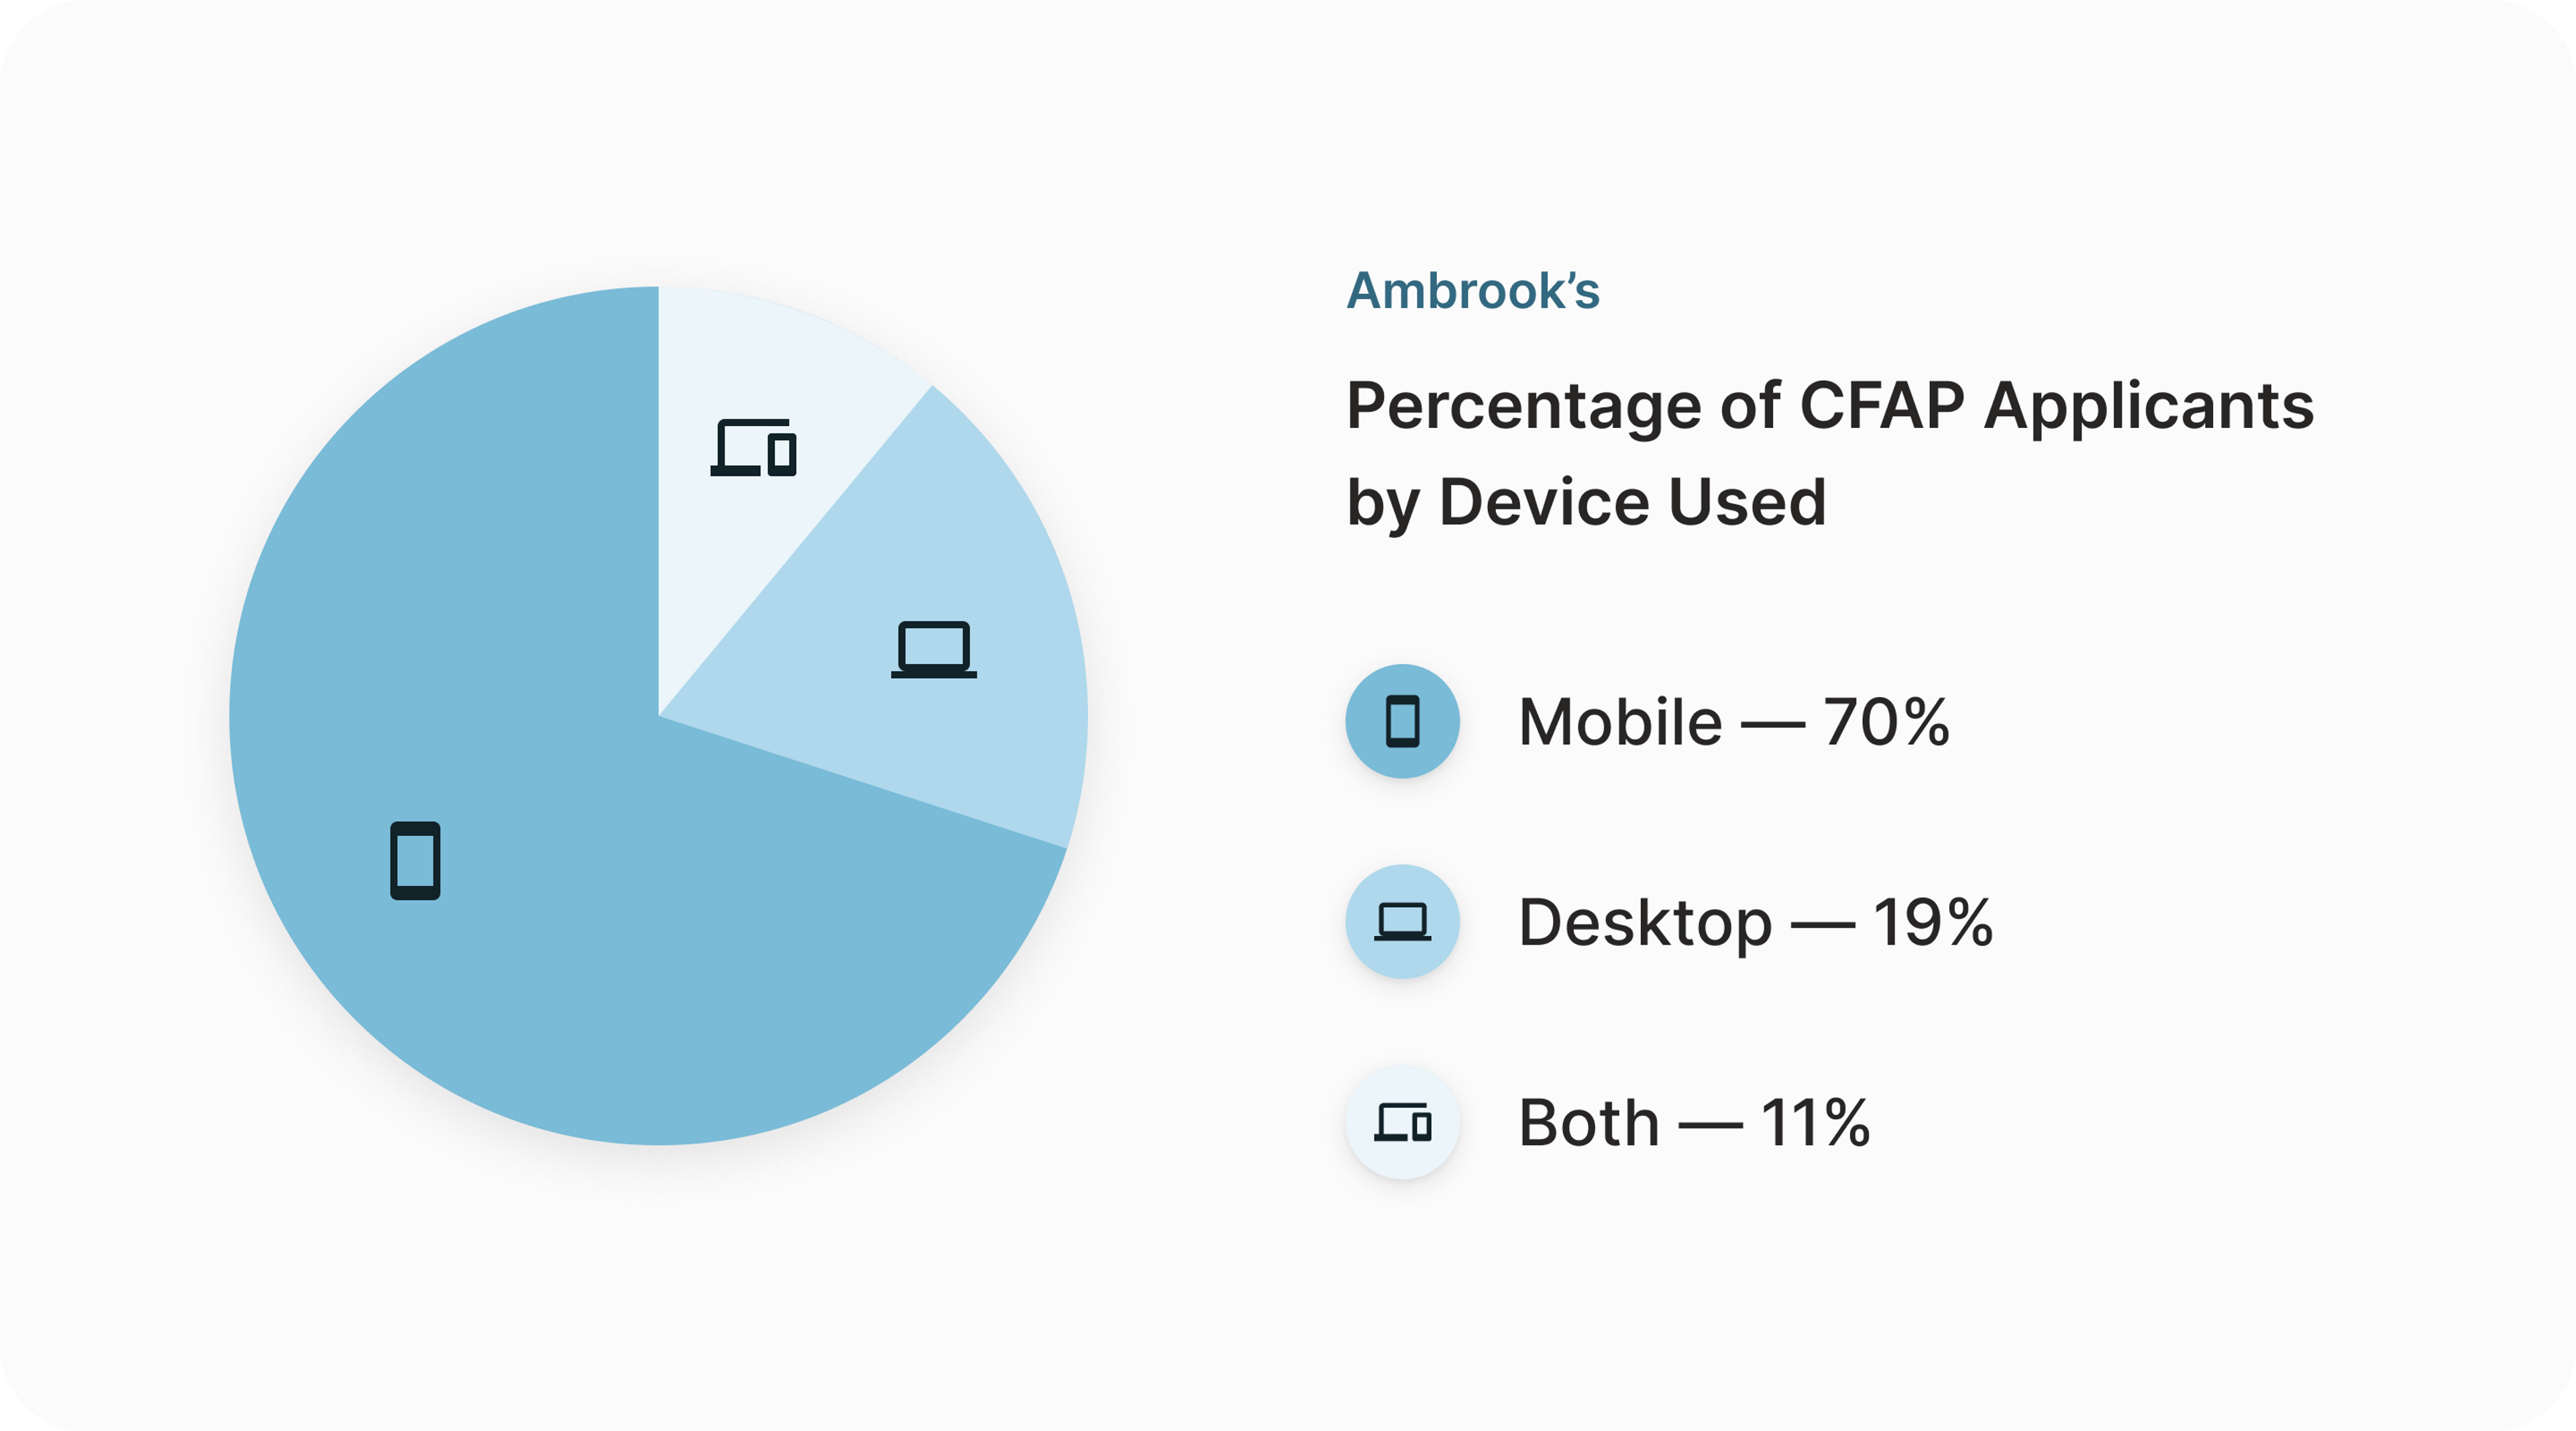
To address the question of digital access even more directly, we have data on the Ambrook side showing that a majority of applicants filled out applications for CFAP via the Ambrook website entirely on their mobile device. While we don’t have the USDA data to compare within subgroups, Figure 1 below shows strong demand for a mobile interface with USDA.
Conclusion
We have provided some preliminary evidence to suggest that digitalization has increased general accessibility to USDA programs and has had particular benefits for the participation of SDFRs. The distribution of CFAP and CFAP2 via a completely online process opens the door for the USDA to do even more of its business of farm aid online where some systemic barriers to SDFR participation may be lessened. There are indications that the FSA is indeed headed in this direction, such as the recent addition of farmland records and map management via farmers.gov.