

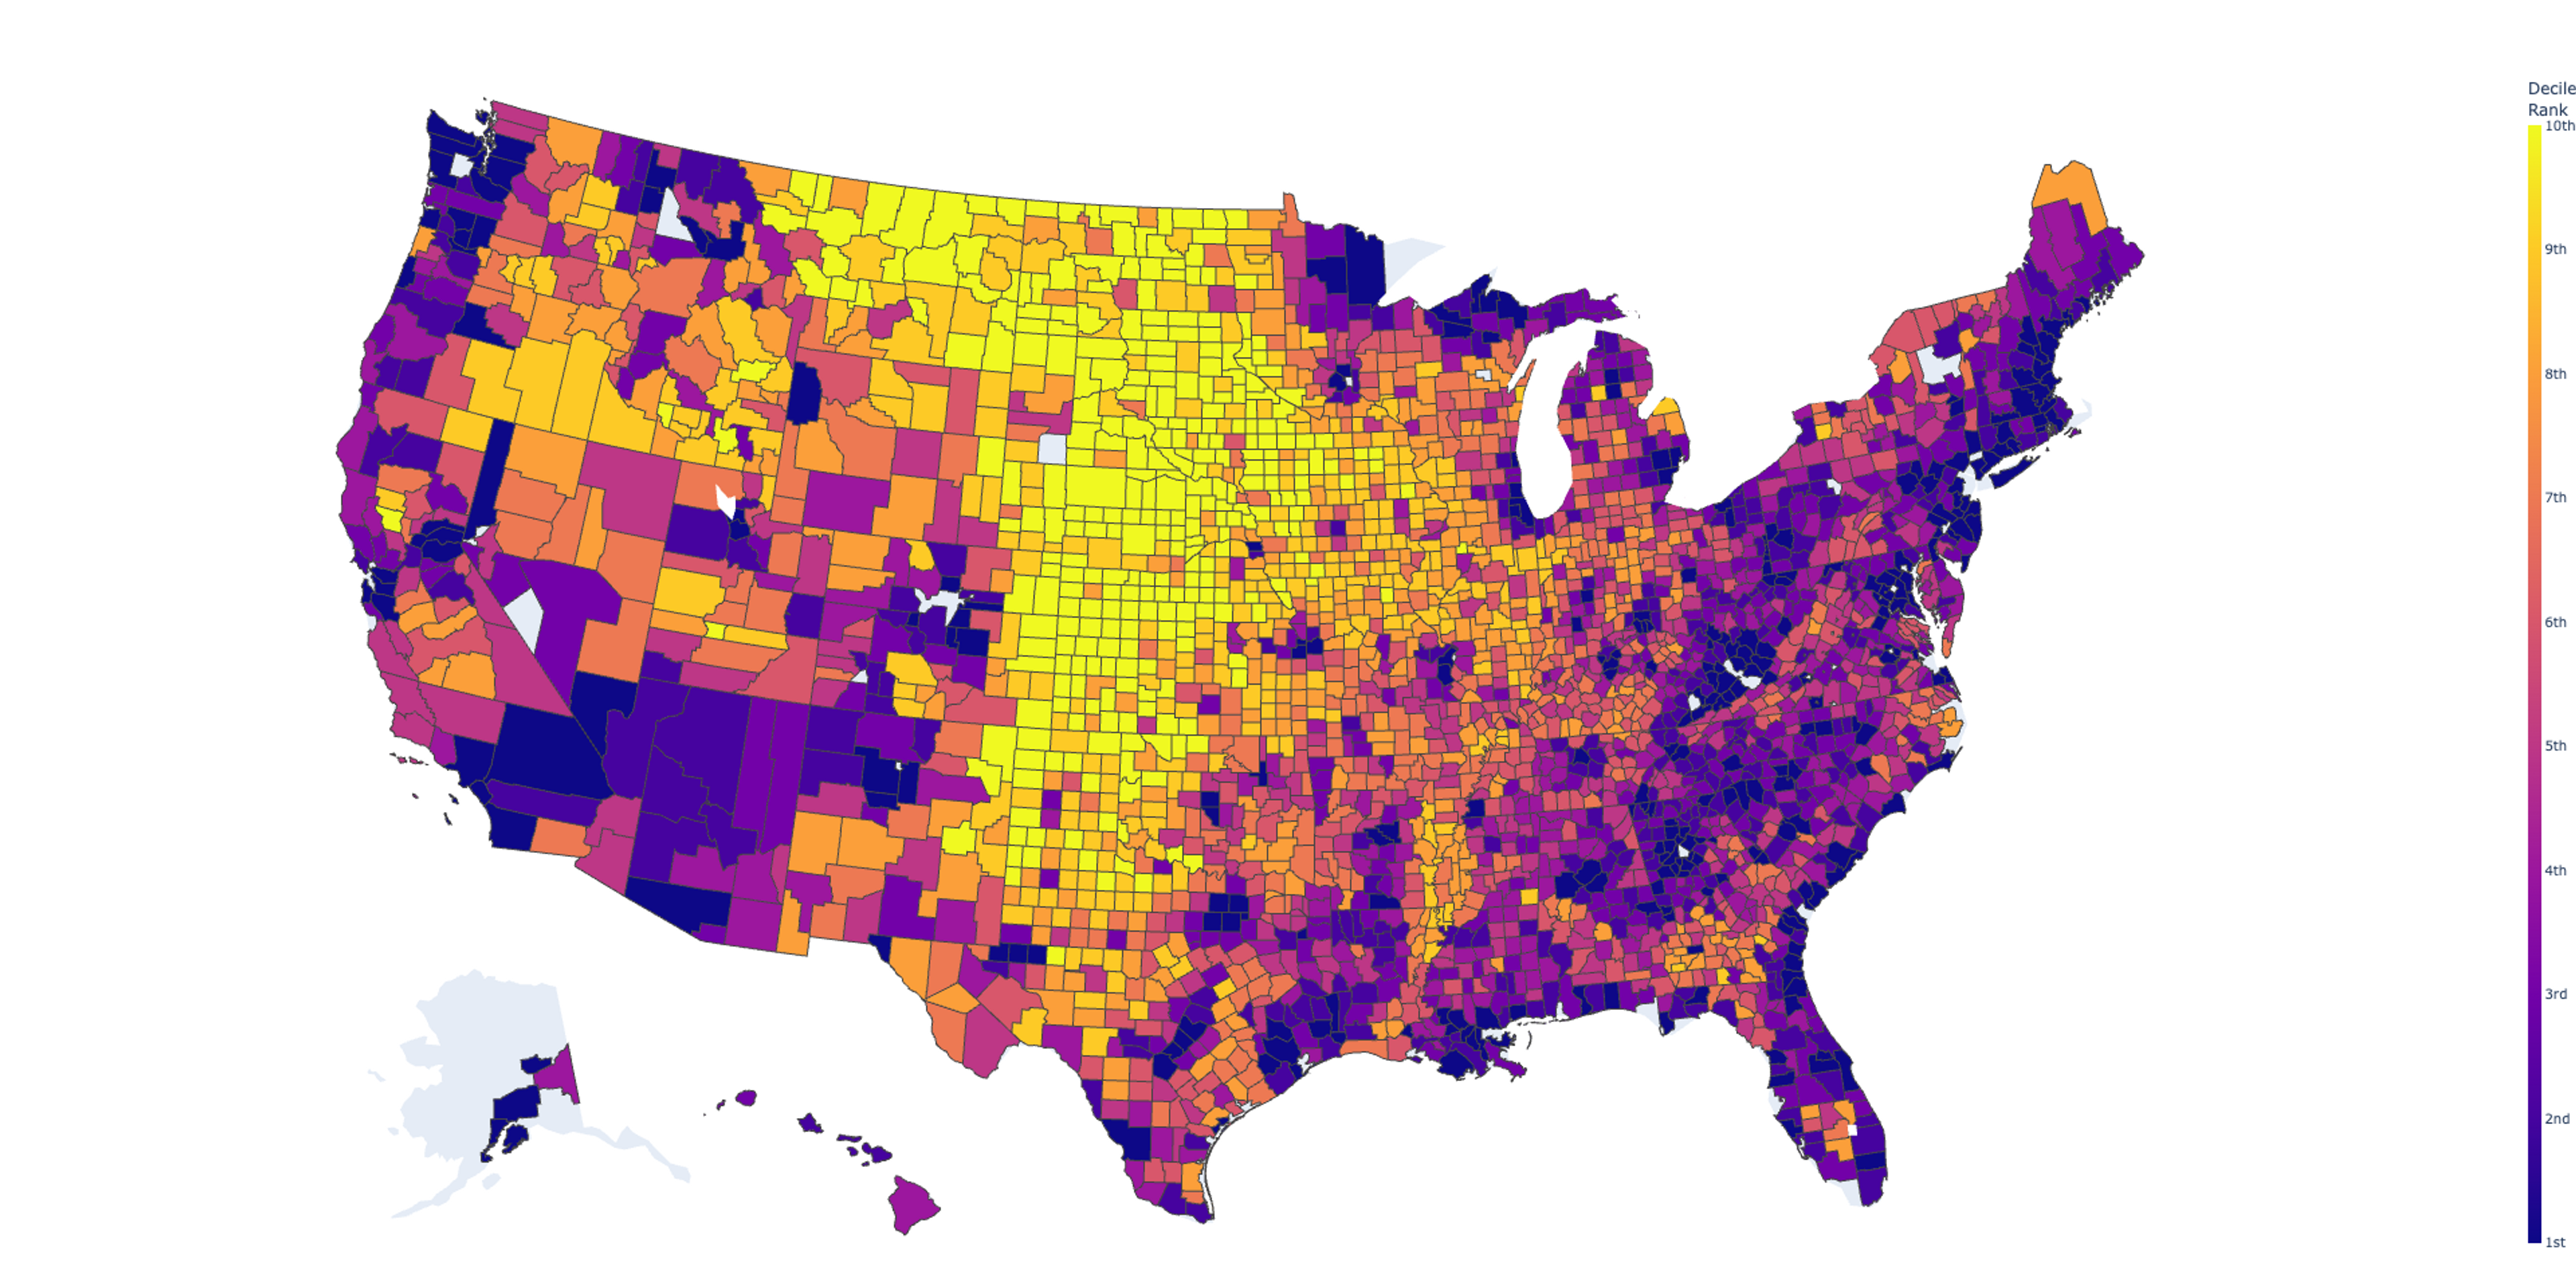
County-level CFAP payment data shows a large gulf between the counties with broadband access and those without.
Welcome to the first blog post from our initiative to explore key questions on agricultural finance and sustainability through data-driven research.
Today, we have teamed up with Aleks Schaefer, PhD (an Assistant Professor in Agricultural Economics at Oklahoma State University) to explore the plight of those farmers and ranchers who may miss out on funding opportunities because they do not have reliable access to the internet. Specifically, we will examine whether farmers without strong internet connections may have missed out on payments from the Coronavirus Food Assistance Program (CFAP), a Covid relief funding program for farms.
The US is in Dire Need of Improved Internet Infrastructure
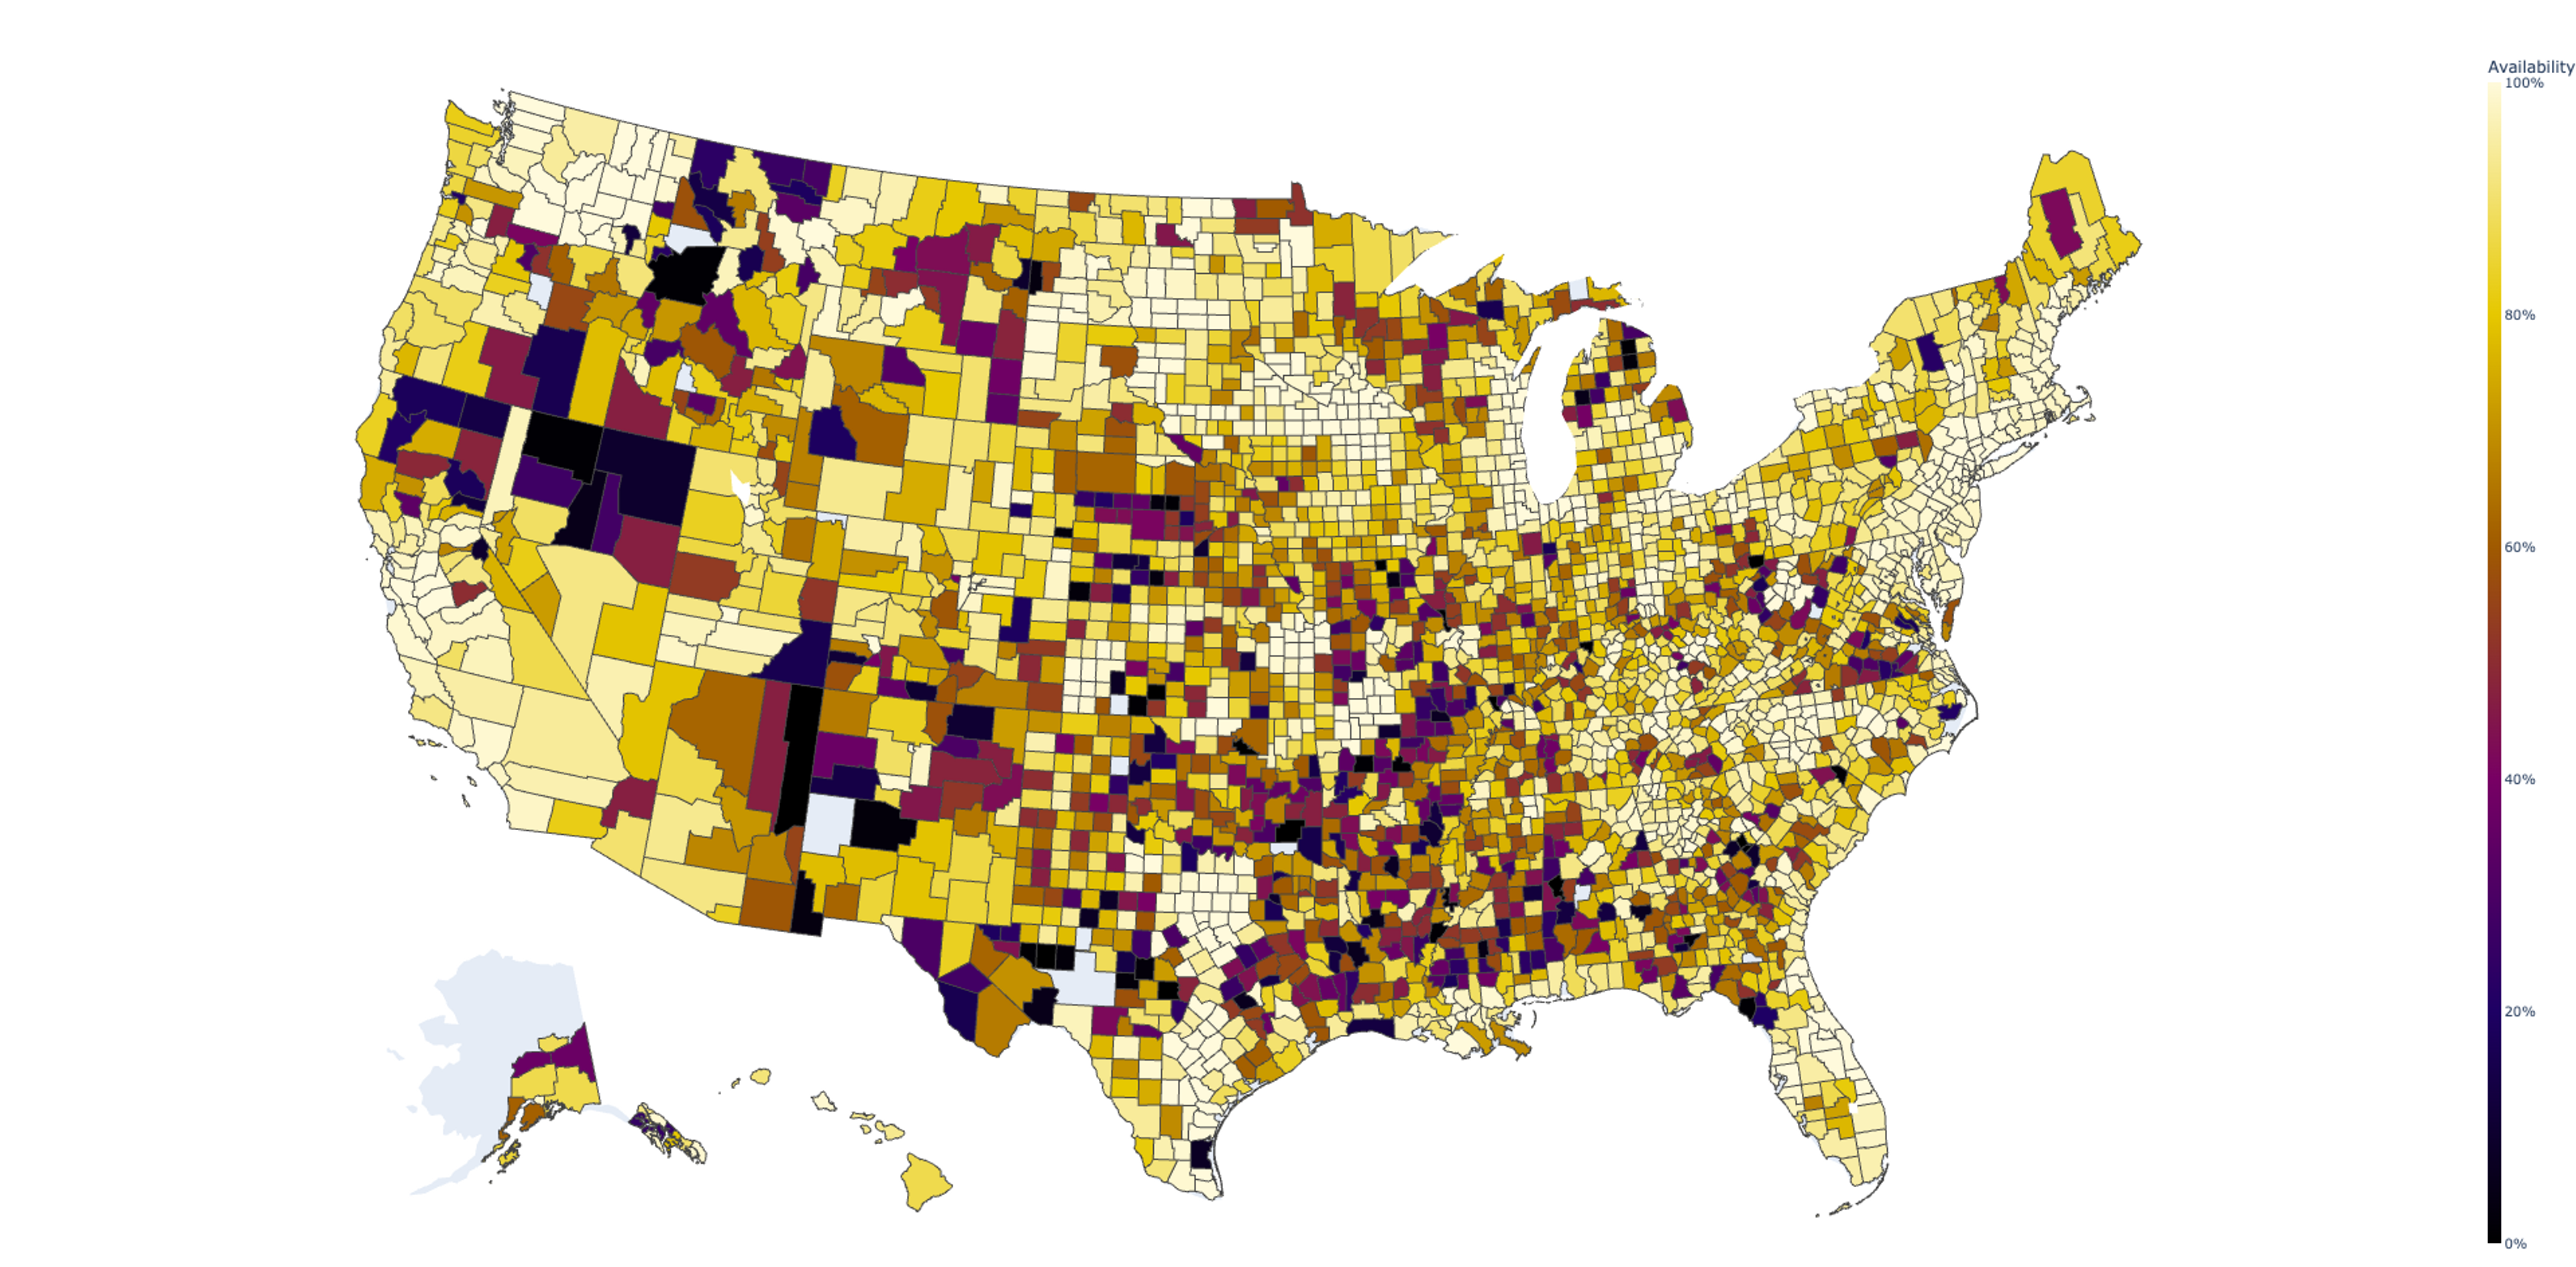
The FCC regularly measures the percentage of Americans who have access to ‘Broadband Speed’ internet. This benchmark represents the minimum speed at which a user can “originate and receive high-quality voice, data, graphics, and video services“, an ability deemed necessary by Congress to participate in modern life on the internet. This benchmark has skyrocketed in importance during the COVID-19 pandemic when internet access has become a lifeline for work, school, and recreation.
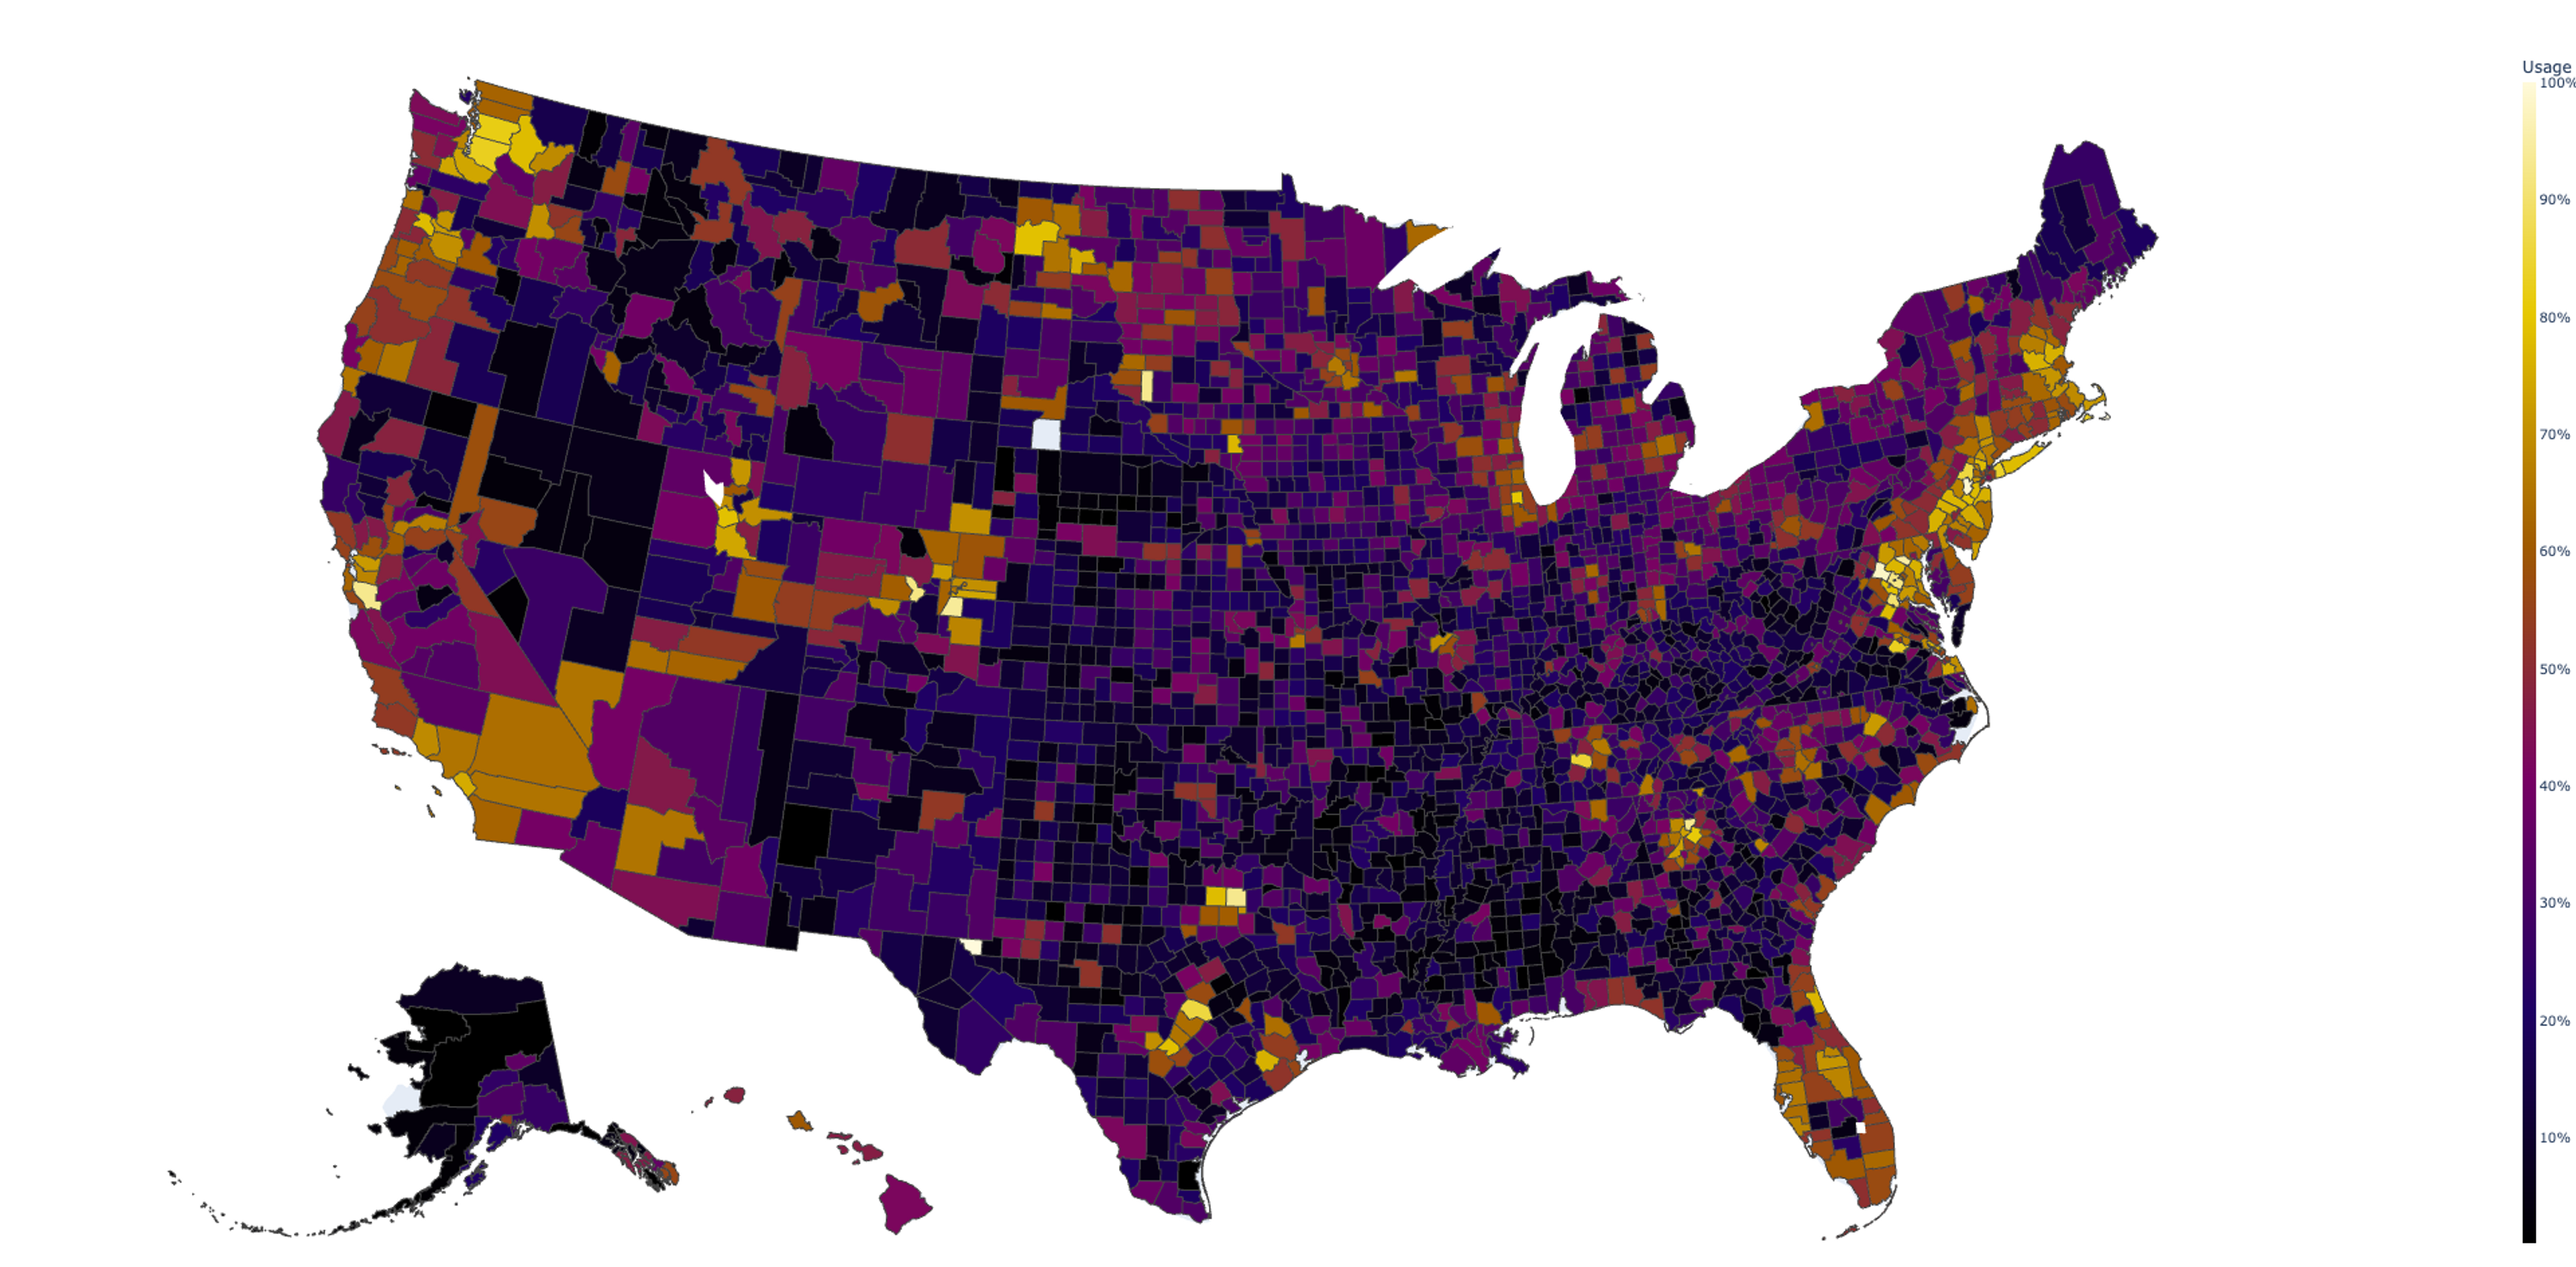
Indeed, the Infrastructure Bill, currently awaiting a vote in the US House of Representatives, includes $65 Billion to bring better broadband access to underserved, especially rural, areas. That decision may have been driven, in part, by the FCC ‘broadband access’ data presented above -- according to which the average county lacks broadband speeds for 24% of its residents. The true extent of the disparity, however, may be even more severe. The other dataset visualized above was gathered by Microsoft and measures broadband usage. Whereas the FCC data is reported by the Internet Service Providers themselves and purports to measure the speeds available to consumers in each county, the Microsoft data measures the speeds at which consumers actually accessed the internet -- whether a consequence of missing infrastructure or affordability.
The Microsoft ‘Broadband Usage’ data, portrayed here as the percentage of people who used the internet at or above ‘broadband’ speeds, describes a situation far more grim -- on average, 75% of the nation’s residents did not use the internet at broadband speeds, with rural areas being much worse off than urban ones. If the FCC data truly represents available broadband, then the difference between the FCC and Microsoft data represents broadband that is available but not used. A possible explanation for that difference is that internet access is both an affordability issue and an accessibility one.
CFAP Payment Distribution
The second piece of data we considered was the total payments made to farmers and producers in each county from the two rounds of the Coronavirus Food Assistance Program (CFAP). We predicted that better access to the internet would help in learning about, and applying for the program. CFAP is a good candidate for analysis because across the two rounds, almost every farming operation in the US was eligible for one or the other or in some instances both. Despite having the same name, CFAP1 and CFAP2 were different programs and farmers could therefore apply to and receive payments from both.
The map above shows that CFAP funds were most intensely distributed to the midwest where most of the country’s row crops are grown. Other agricultural hotspots, such as the CA Central Valley and NY Hudson Valley, received a large amount of CFAP money, but much less relative to the population of those counties.
The two rounds of CFAP were slightly different:
CFAP1 was funded by the CARES Act and the Commodity Credit Corporation (CCC) to the tune of $16B and paid out only to producers who were harmed by a 5% or more price decrease because of loss of demand due to the COVID-19 pandemic. Application to CFAP1 was open for 108 days: From May 26th, 2020 to September 11th, 2020.
CFAP2 was funded entirely by the CCC with a $13B budget, and paid not only for crops that faced a 5% price decrease (“Price Trigger Commodities”), but also paid producers a flat rate for losses on the sale specialty crops (“Flat Rate” and “Sales Commodities”) based on the producer’s 2019 sales. Application to CFAP2 was open for 81 days: September 21, 2020 until December 11, 2020.
While CFAP2 increased the list of eligible products, the same counties benefited from both rounds of the program.
A Model of the Impact of Internet Access on CFAP Payments
We built our model using CFAP payment data, broadband access data, each county’s Rural-Urban Continuum Code, and other demographic data to measure the impact of internet connectivity on CFAP payments. All data was standardized to the US County level.
Our Model is a Linear Regression Model specified as follows:
| Dependent Variable | |
|---|---|
| CFAP payments per capita received by county residents ($) |
| Independent Variables of Interest | Expected Impact |
|---|---|
| % of County Population Who Use the Internet at Broadband Speeds (>25Mbps) | Positive |
| County’s Rural-Urban Continuum Code | Positive |
| % of County that Voted for the Republican Candidate in the 2016 Presidential Election | Positive |
| Independent Control Variables | Expected Impact |
|---|---|
| County Area (Sq. Miles) | Positive |
| % of County Population Employed in Agriculture | Positive |
| Income per Capita ($) | Positive |
| Dummy Variables Representing the State in Which the County Resides | Positive |
We settled on this model after experimenting with various sets of independent and control variables. The final variables chosen exhibited statistical significance that were robust to variations in the specification.
Model Findings
Our main model yielded the below coefficients, all but one of which were statistically significant at the 99% confidence level:
| Variable | Coefficient |
|---|---|
| % of County Population Who Use the Internet at Broadband Speeds (>25Mbps) | 426.6385*** |
| Income Per Capita ($) | 0.0210*** |
| County Area (Sq. Miles) | -0.0237* |
| % of County Population Employed in Agriculture | 135.3075*** |
| Rural-Urban Continuum Code | 22.7194*** |
| % of County that Voted for the Republican Candidate in the 2016 Presidential Election | 666.7697*** |
Broadband Usage was related to increased CFAP payments
The most striking result from this model is the large and statistically significant relationship between being able to access the internet at broadband speed and an increase in CFAP dollars received: Every additional 1 percent of a county that uses broadband was associated with a $4.26 increase in CFAP funding per capita. At a more relevant scale: a county where 50% of the population uses broadband speed internet could expect to receive $42.60 more in CFAP payments per capita than a county where only 40% of the population uses broadband speed internet. That is almost a third of $132, which is the median county’s CFAP payment per capita.
CFAP1 payments were more sensitive to Broadband Usage than CFAP2 payments
Beyond our base model, we found that the size of the effect of broadband usage on CFAP2 payments was less than the size of the effect on CFAP1 payments. A possible explanation for this is that the program was better publicized or just better known in the second round, and therefore more who do not use the internet at broadband speed were able to apply. It is also possible that CFAP2’s broader eligibility created more word-of-mouth marketing.
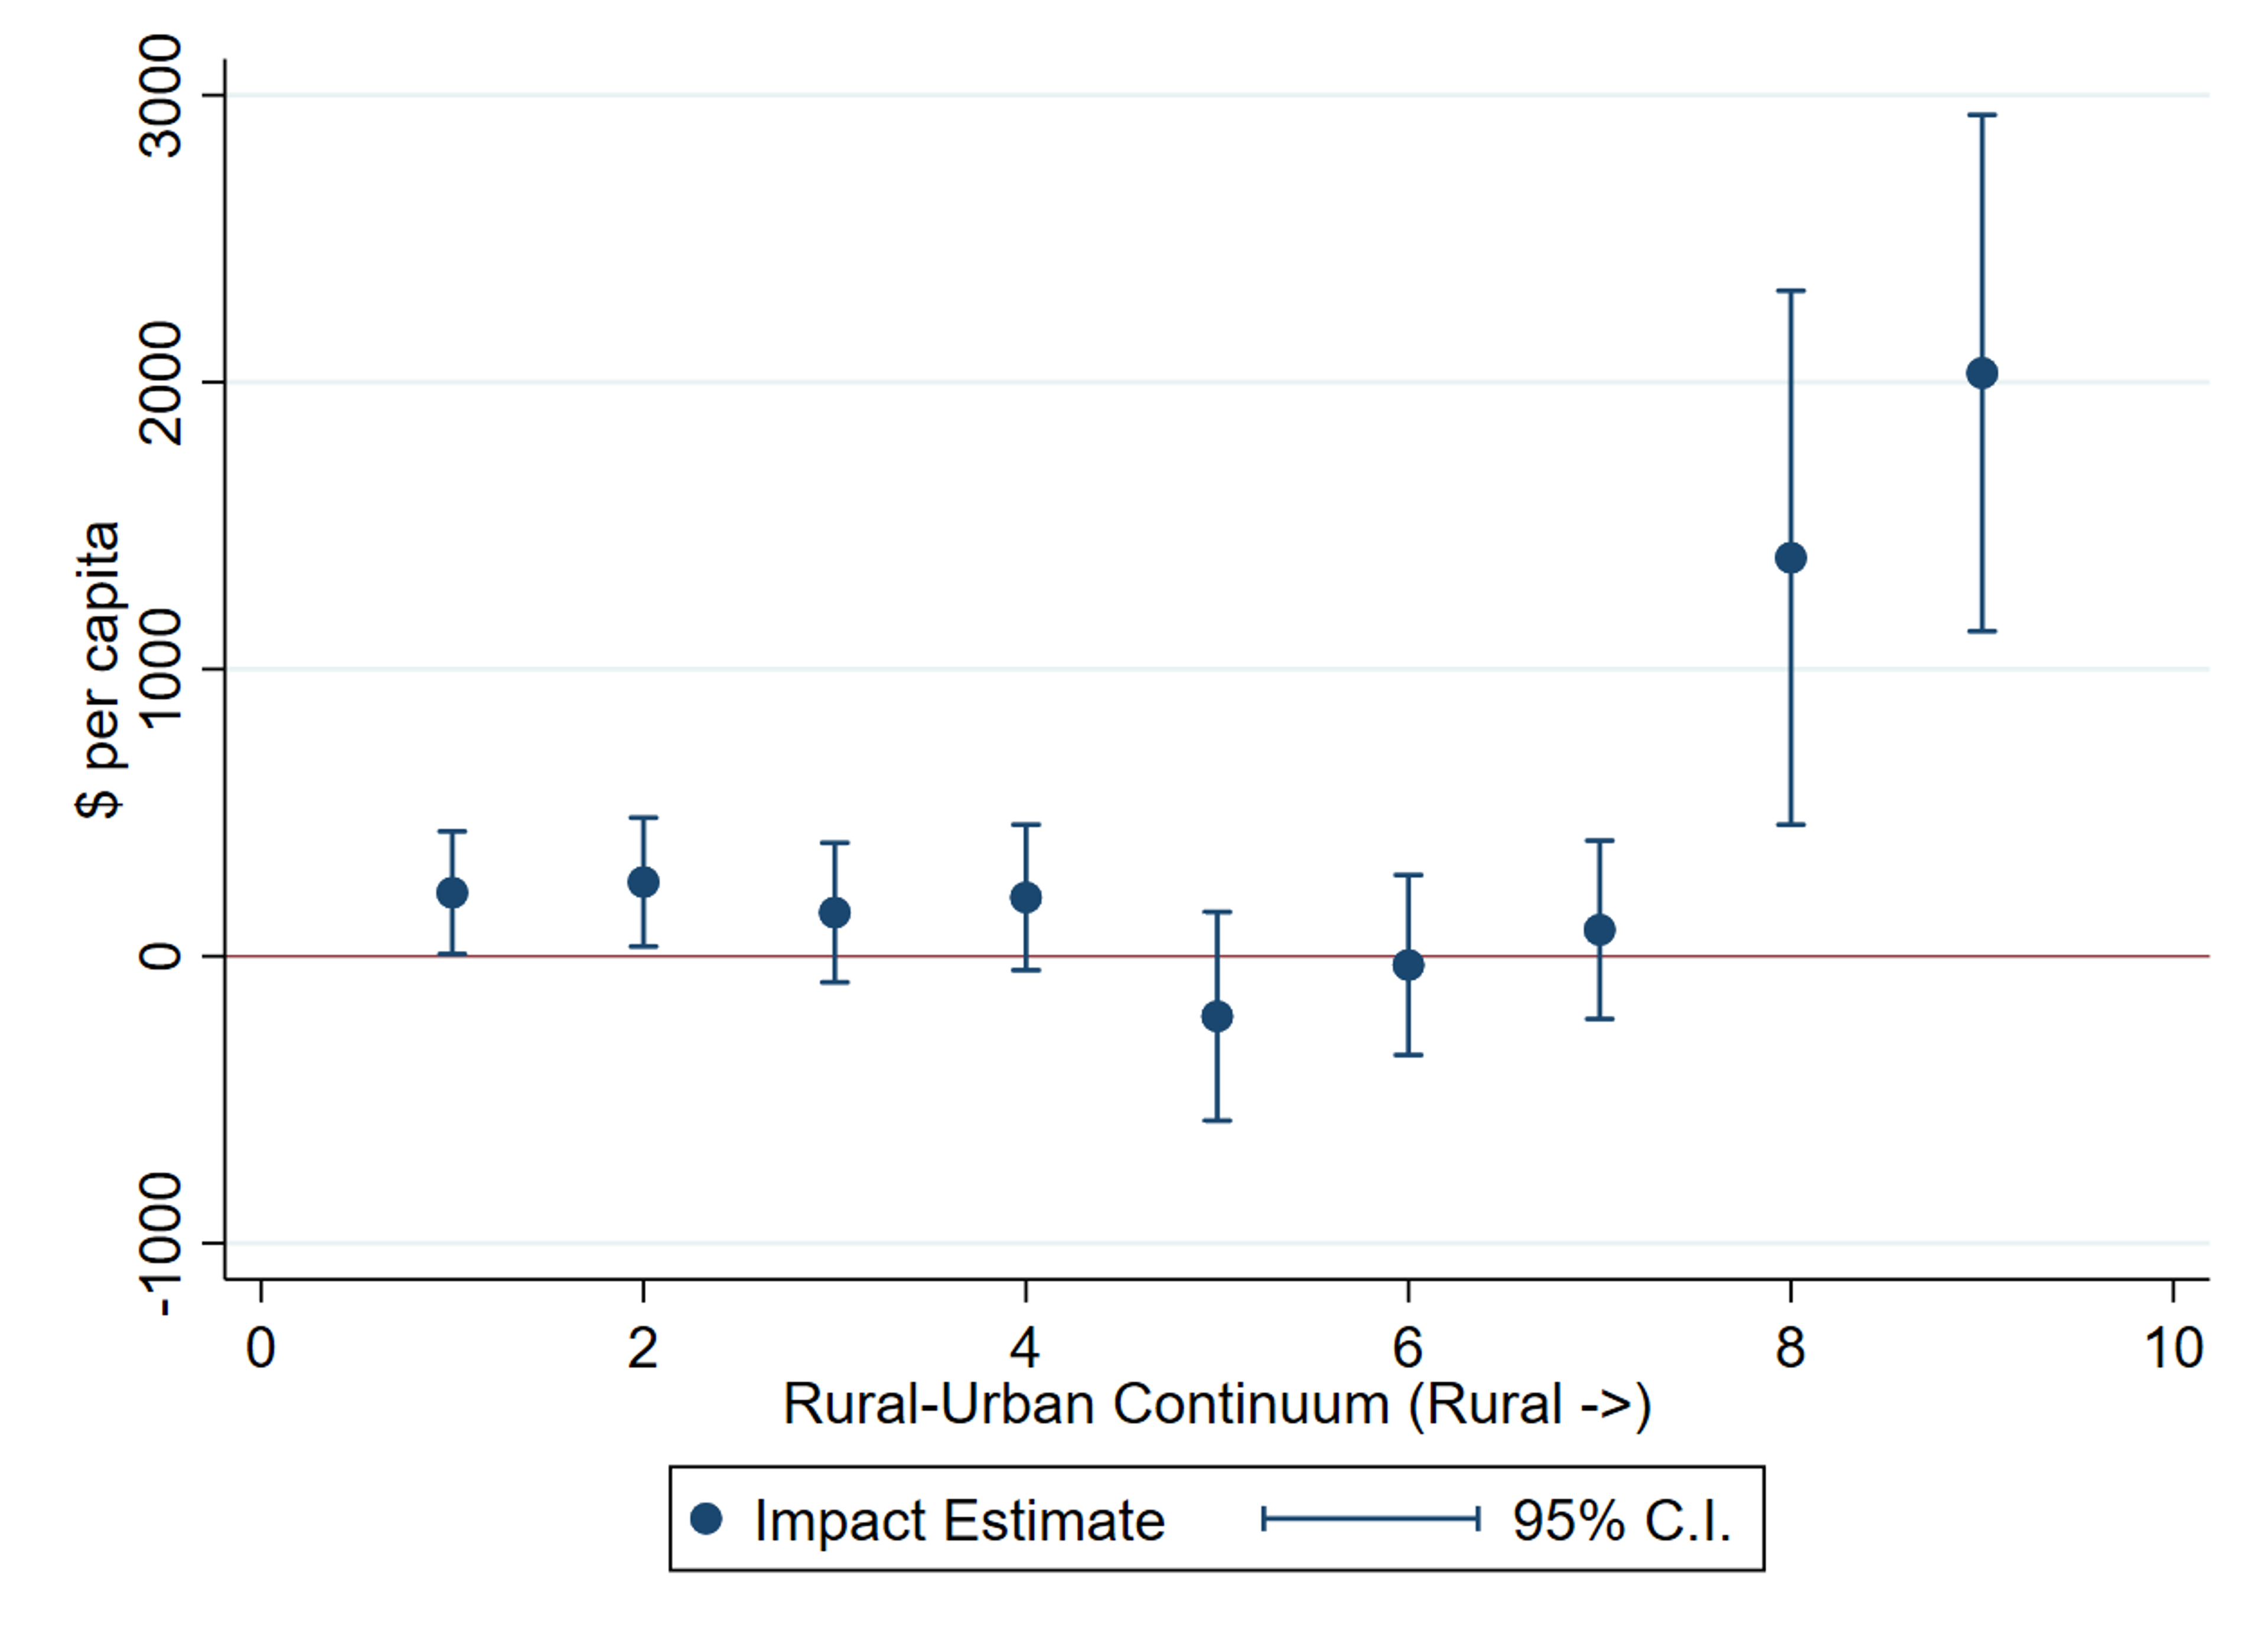
Broadband Usage was most impactful for the most rural and the most urban counties
A final interesting finding was that the size and significance of broadband usage’s effect on CFAP funding varied greatly based on whether a county was more rural or urban. The chart below shows that broadband usage had the biggest impact on CFAP payments for the most rural counties (8 and 9 on the Rural-Urban Continuum or RUC). This is not surprising because the most rural counties have many farming operations and are known to have poor internet connectivity. What is more surprising is that the next largest effect is seen in the most urban counties (1 and 2 on the RUC), where broadband speed is certainly available, but perhaps unaffordable to the least affluent subset of the population or inaccessible for other reasons. The peri-urban and suburban counties in the middle of the spectrum showed small-to-non-existent relationships between broadband usage and CFAP payments.
Conclusions
Although it is difficult to claim a causal relationship from non-experimental data, it is clear that access to the internet has a strong and significant correlation to the distribution of CFAP funding to farmers. The results of this model support the thesis that strong digital infrastructure built on a backbone of fast, affordable internet may provide important support to disadvantaged farmers and ranchers. Large agribusiness operations will usually know about farm aid and have the staff and scale to apply for it, but the difference between CFAP1 and CFAP2 shows that smaller operations may take more time and outreach to elicit applications. Rural counties may be especially vulnerable to missing out on USDA services due to lack of good internet. If the pending infrastructure bill passes, those given authority over the investment in internet infrastructure improvements should be careful to consider affordability as well as accessibility.